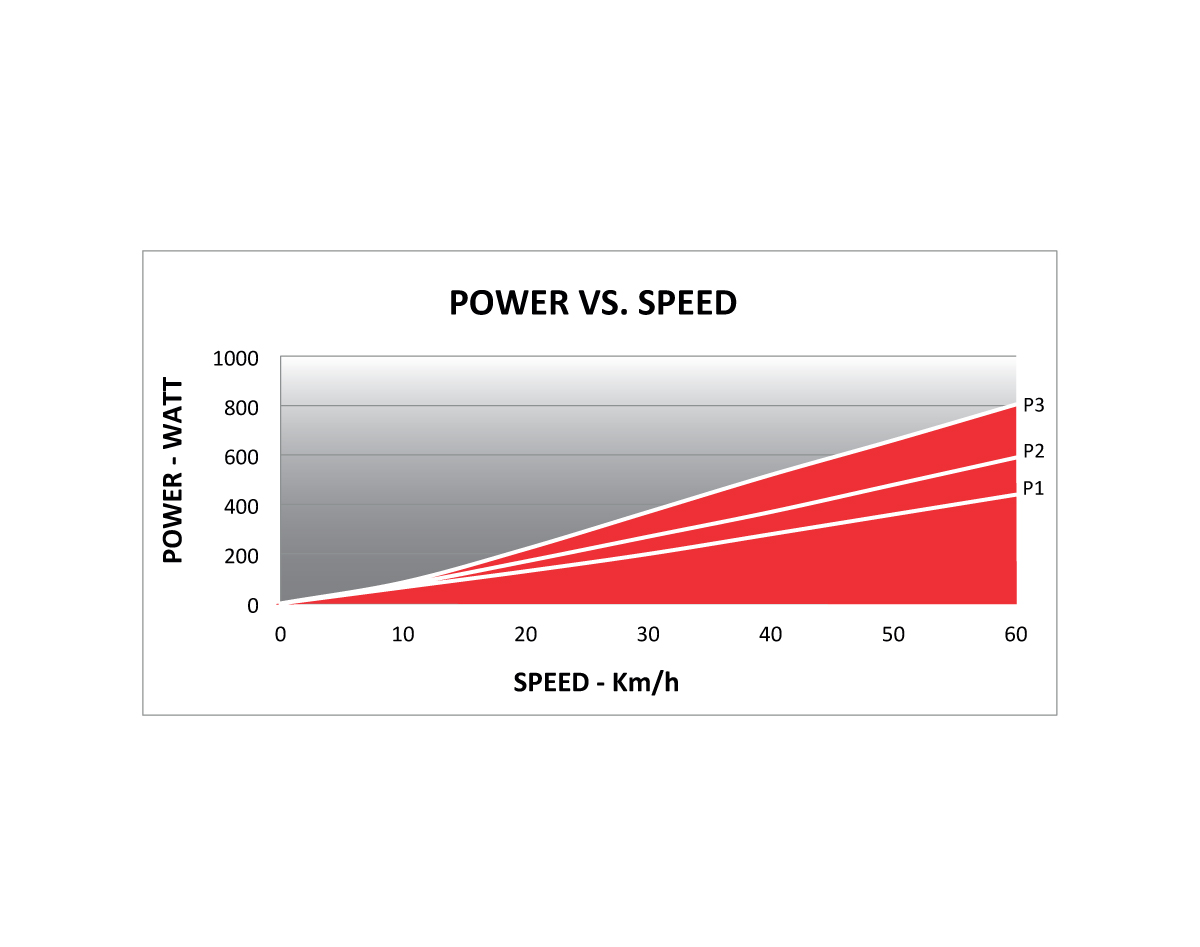
In attachment the picture with the power/speed curve that I used to derive the formula for the Elite Arion Mag. Can’t attach the Excel file used for the calculation.
- Open the picture with an image viewer that shows pixel coordinates (GIMP, Irfan View,…)
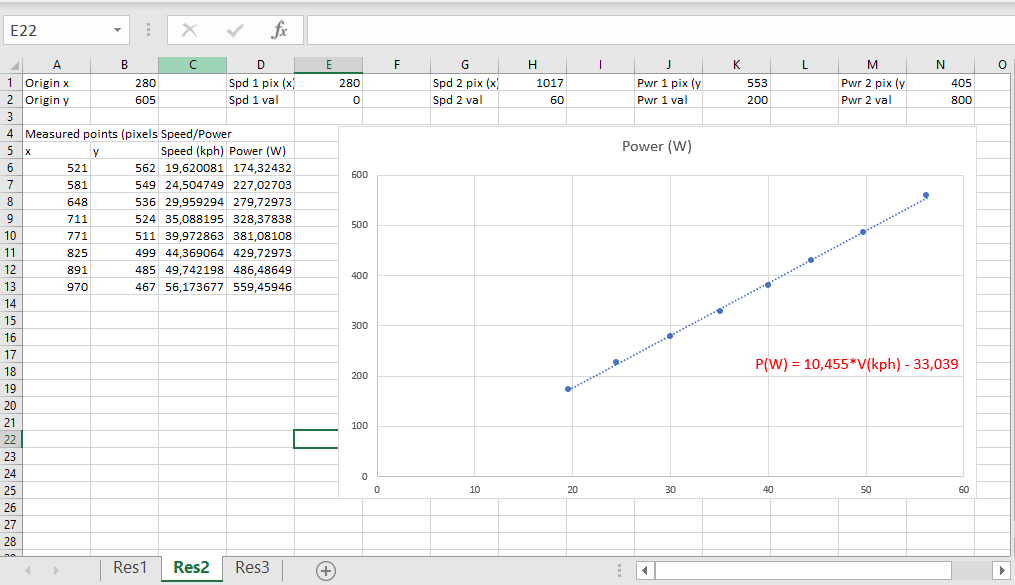
- Zoom in on the picture and determine the intercept of X and Y axis. Enter the coordinates on the first tab of the Excel file
- Find 2 well determined speed values and enter their value and coordinates. In this case there were no vertical raster lines, so I used the 0 intercept and the 60kph end of the chart.
- Do the same for Power. Find 2 values/coordinates.
With the above information, we can now calculate the exact position of every pixel and transform it to a Speed/Power value.
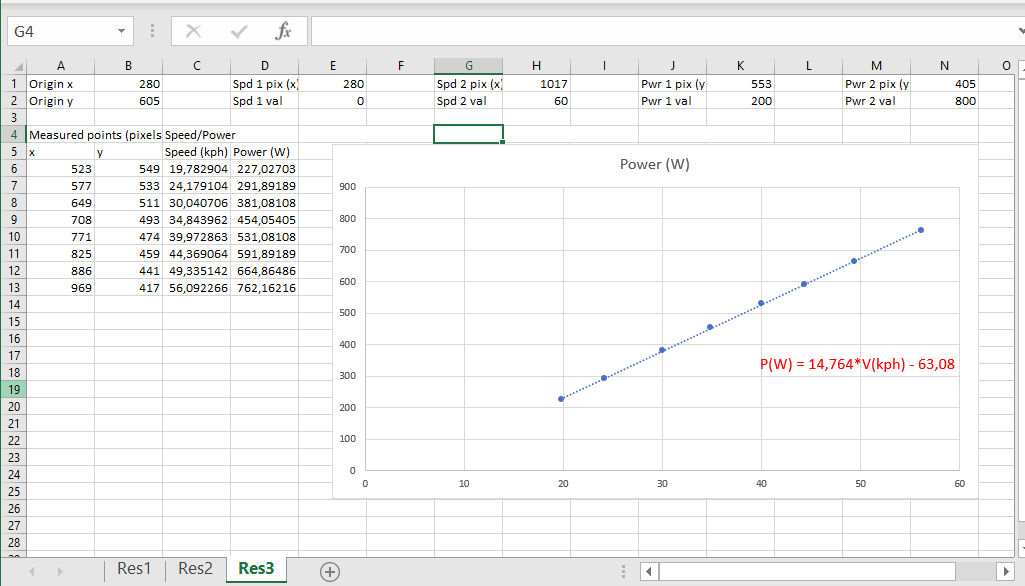
- Move your mouse cursor over the different resistance curves and enter the coordinates of a number of points in the columns x and y for Measured Points.
The excel file does the rest. It plots the points, adds a Trendline and displays the formula.
If you want your trainer listed in the app, give @Alex your exact Brand/Model and the formula’s determined this way.