“I really wish I had more time to spend on testing this slope mode like you do”
All you need is one minutes and 20 seconds
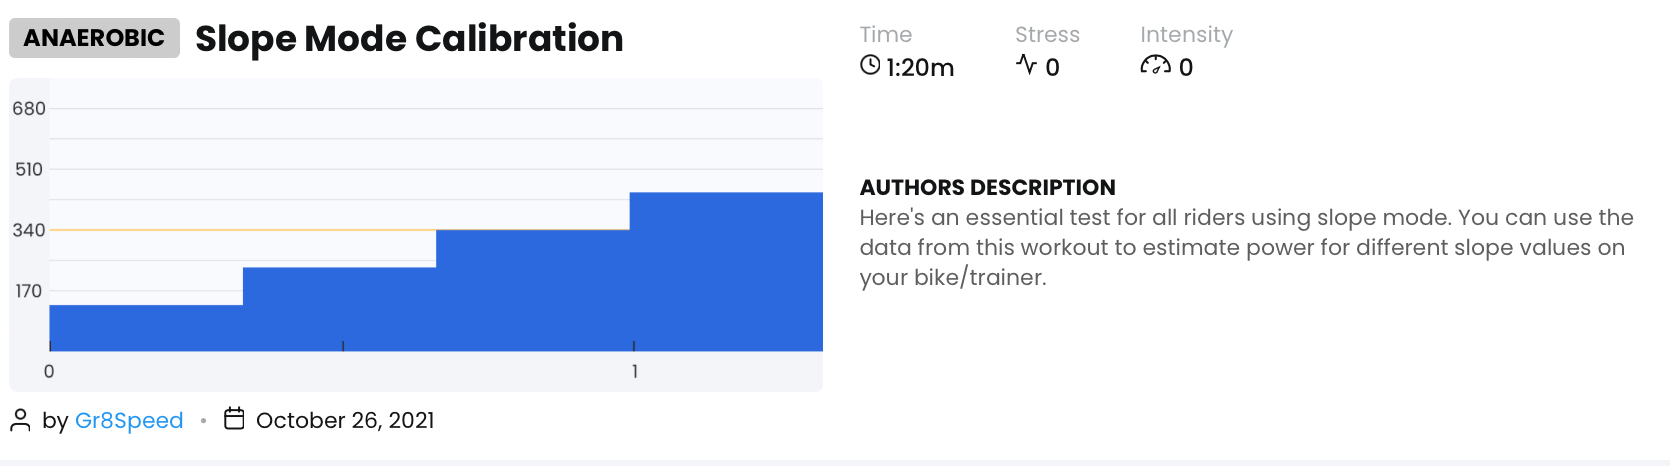
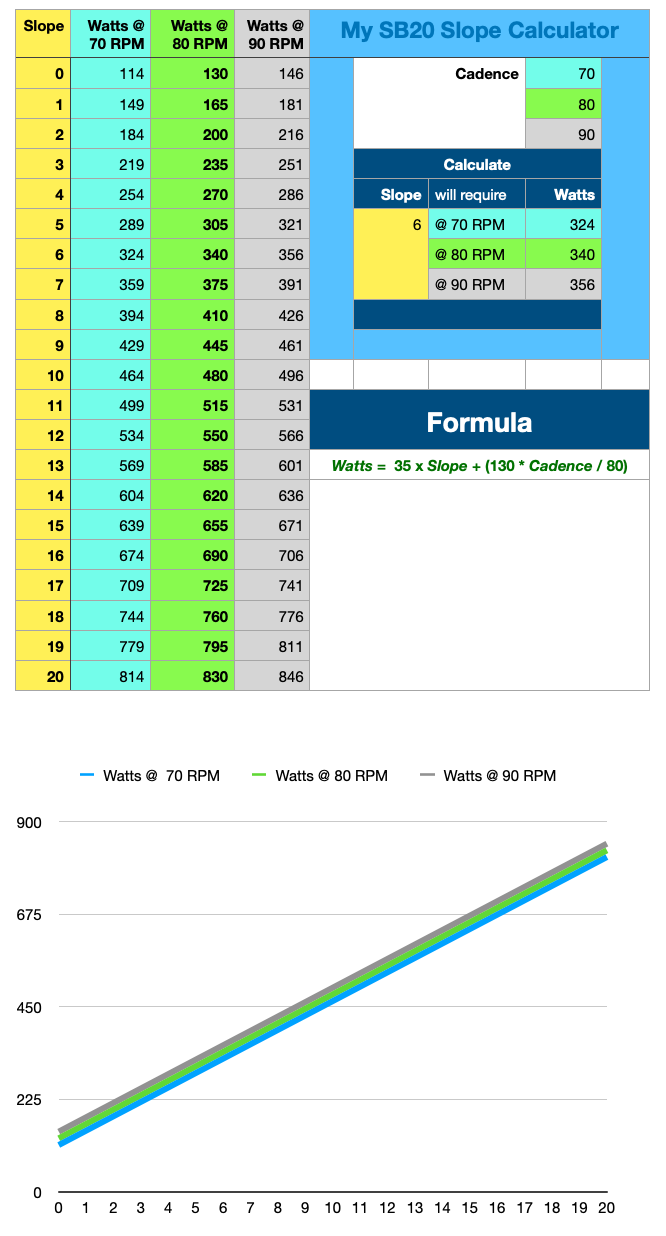
I have built a single test workout that needs to collect only 4 data points @ 80 RPM for slopes: 0, 3, 6 and 9%. It takes just 1m 20s. Everything else on my spreadsheet, including other RPMs and slope values are interpolated automatically.
Wow, that is super cool. Yes with smart trainers some people always keep it in the same gear but my guess is that is the minority. But if they were serious about automatic slope mode they could keep it in the same gear.
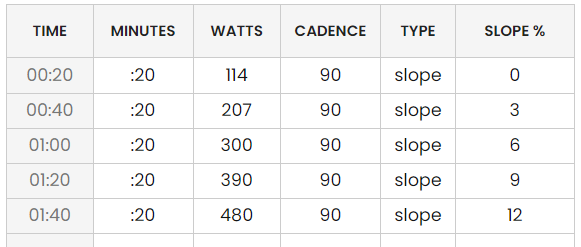
Can you give us some insight into this calculation? I just performed your sample test on my SB20 with an additional 20 seconds @ 12% and running at 90 RPM:
All settings are the same between TD and Stages (FTP, weight). My numbers are wildly lower than expected:
We don’t do anything with this calculation. We just send the slope and your weight to the trainer. The trainer does the math. In this case you just need to increase your gearing to get it to match your expectations for slope and power output.
Thanks, Alex. Yeah, I messaged Craig directly about the calculation. That was more for my own curiosity. But like him I have the SB20. I’m just wondering why my trainer is so far off the estimated watts I should be seeing. I have the bike set to external so it should just get the slope value sent to it and handle the resistance. Gearing shouldn’t be involved but I’ll take a look - I don’t have the bike controlled by my Stages app. I’m pretty sure 12% slope would require more than 330 watts at 90 rpm.
I don’t know how the SB20 works with gearing but obviously in a normal bike it makes a huge difference in the watts output. Big gear 12% is impossibly high power at 90 rpm. I am curious what you find so let me know what you and Craig find out. The only test I can think regarding our app goes is change your weight to 200kg and see if it requires a lot more power. If not there could be a problem of how we are sending weight.
I’m pretty sure 12% slope would require more than 330 watts at 90 rpm.
6% slope is approximately 340w @ 80 RPM. All smart bikes - not just the SB20 should calculate roughly the same watts for a rider of the same weight. This is the intention of the Ant+ FE-C and Bluetooth FTMS Slope command. That’s how my spreadsheet calculates it too:
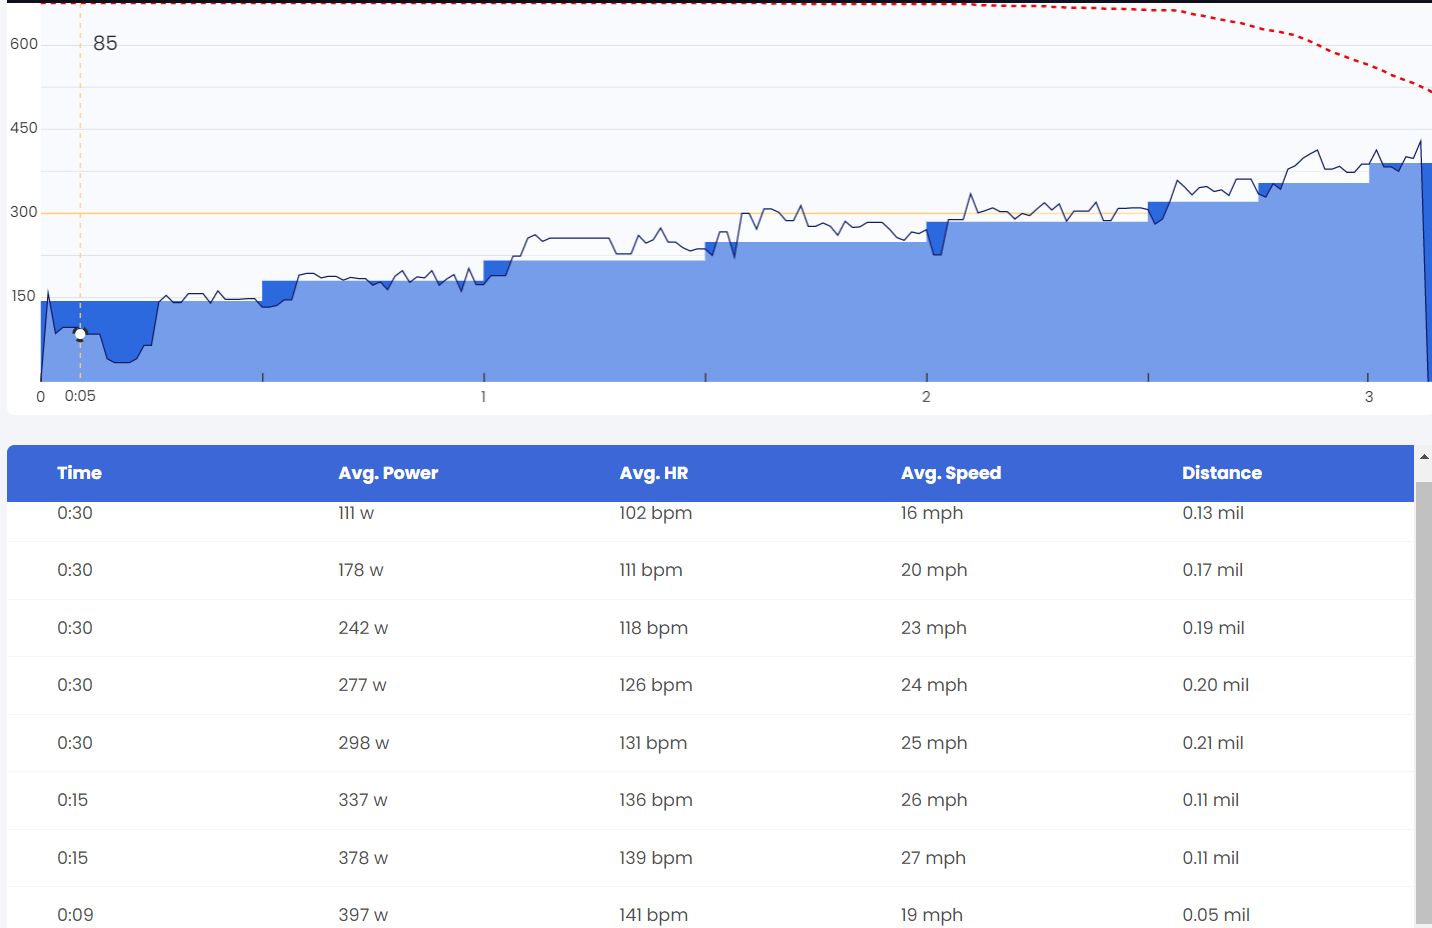
I think I finally figured it out. Turns out the SB20 does use gearing when in slope mode. I thought it was just used for sim mode and not for external controllers.
I tried several tests using 1% increments. I was able to maintain expected wattage for each slope increment using gear changes for one of the tests:
I found a calculator online that estimates cycling wattage on a number of factors, and it seems the SB20 uses roughly the same formula. It appears I’m not meant to be a climber. Although it will be fun to have my cycling buddies try it out and see what it’s really like for me in the mountains.
Yes I call it slope mode but I think it is actually sim mode. I think on some trainers their is a difference. Since we specify slope when sending to the trainer we decided to just call it slope mode. Glad you figured it out I am not a climber either…
It is unfortunate that we need to use a term like “slope” to describe “fixed resistance that varies watts proportionally with pedalling speed”. I guess that why some bike vendors use the term "Sim mode" - the only mode that simulates a real bike. I’m with you Jim. I’m not a hill climber yet Slope mode is the smart bike feature I use the most.
The problem is Smart Trainers. We can’t ask a smart trainer to give us something like the equivalent of 400w @ a cadence of 80 RPM. Why? The rider can change gears. We can get a predictable number of watts only if the rider agrees to set a particular physical gear and not change it. This is not a problem with Smart Bikes where you can use “sim resistance mode” to control resistance and the virtual gear automatically.
I use slope mode in the default SB20 virtual gear (the gear selected after power-up) which is Dream Drive Level 50 out 100. I let the workout app control slope to create sprints of 10 to 30 seconds at 500w and higher. I never change the virtual gear so watts are predictable. That’s good. For workouts my goal is to hit a watt target. I don’t really care what the slope is. I pedal harder if I can. If I can’t stay at 70 RPM and above, I with decrease the slope next time I do the workout.
Other use cases use Slope mode to model physical hills. To me this creates a “simulation” and not a workout. Like riding up a physical hill you can change gears. As such, the watts you get are unpredictable. I let the workout app do the work.
I am very keen on using slope mode & erg mode in my Trainer Day workouts.
Perhaps a stupid question but I have done your test protocol on my Tax Neo & single speed bike and have created a spreadsheet. However I think I have one or two dodgy numbers.
Could you possibly confirm in your spreadsheet formula where the 35 & 130 come from.
Many thanks for all your help on this fascinating topic.
Hey Karl. The parameters just represent the straight line that estimates power versus slope using the good old y=mx + b formula i.e., the sloped straight line formula that we all learned in high school . To get it, I simply record power numbers for 3 or more different slopes at a fixed gear and cadence.BTW: to better control cadence I use a metronome app on my phone.
Once you have 3 or more points representing x and y, you can calculate m and b. The easiest way to do this: Put the points in an Excel spreadsheet. Create a line graph, and then enable the “trend line” option on the graph i.e., show the best sloped straight line that fits the points you have plotted . Excel gives you the y=mx+b formula for this line. That’s where 35 and 130 come from for my SB20 bike. 130 was actually added later use a devisor once I realized that cadence simply moves the graph up or down along the y-axis i.e., it just changes b. I simply did the test again for 3 different cadences and just one slope. Now the formula is complete. I still use it when creating new slope workouts. I haven’t done erg mode intervals since slope mode was added.
It’s too bad TrainerDay doesn’t calibrate y=mx+b automatically by recording 3 slopes on your particular bike/trainer (they could actually get away with just 2 points). This would make slope mode in a killer feature. As it is, only math students can really leverage it
My guess : Your trainer will have a different value for b since your fixed gear will be different. You should end up with m somewhere around 35.
Wow. Thank you very much Craig for your very clear & detailed explanation. Fantastic!
So armed with your information I redid the test (excellent tip with the metronome app) and plotted the info in Excel and … success it works perfectly.
I can now create my ideal workouts with confidence and from my initial experiments I seem to favour the short recovery intervals also being in slope mode, but time will tell.
So grateful for all of your help on this topic enabling people like me to be able to get even more pleasure from their cycling.
Thanks Karl. You have illustrated the value of creating your own custom workouts. Most stock workout packages use percentage of ftp to vary only power. That’s too bad. Changing interval length and recovery time lets you create better workouts, for different goals - just for you.
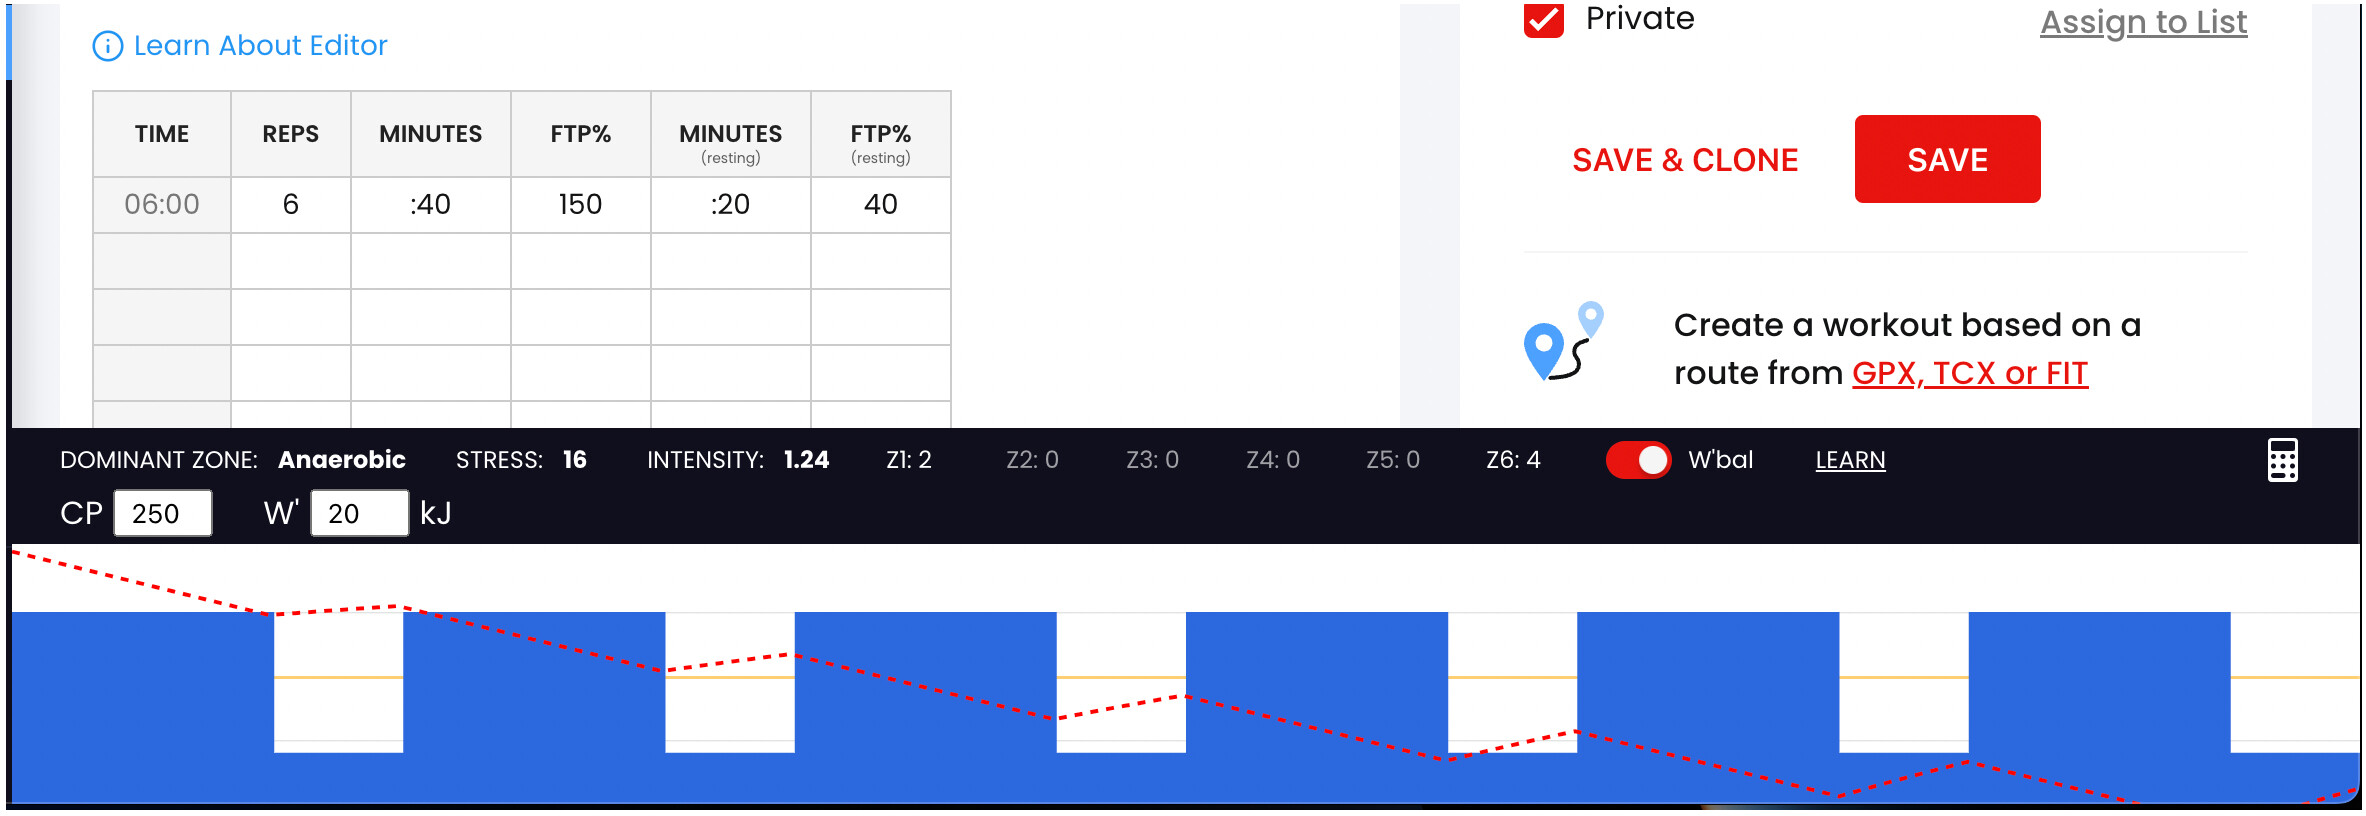
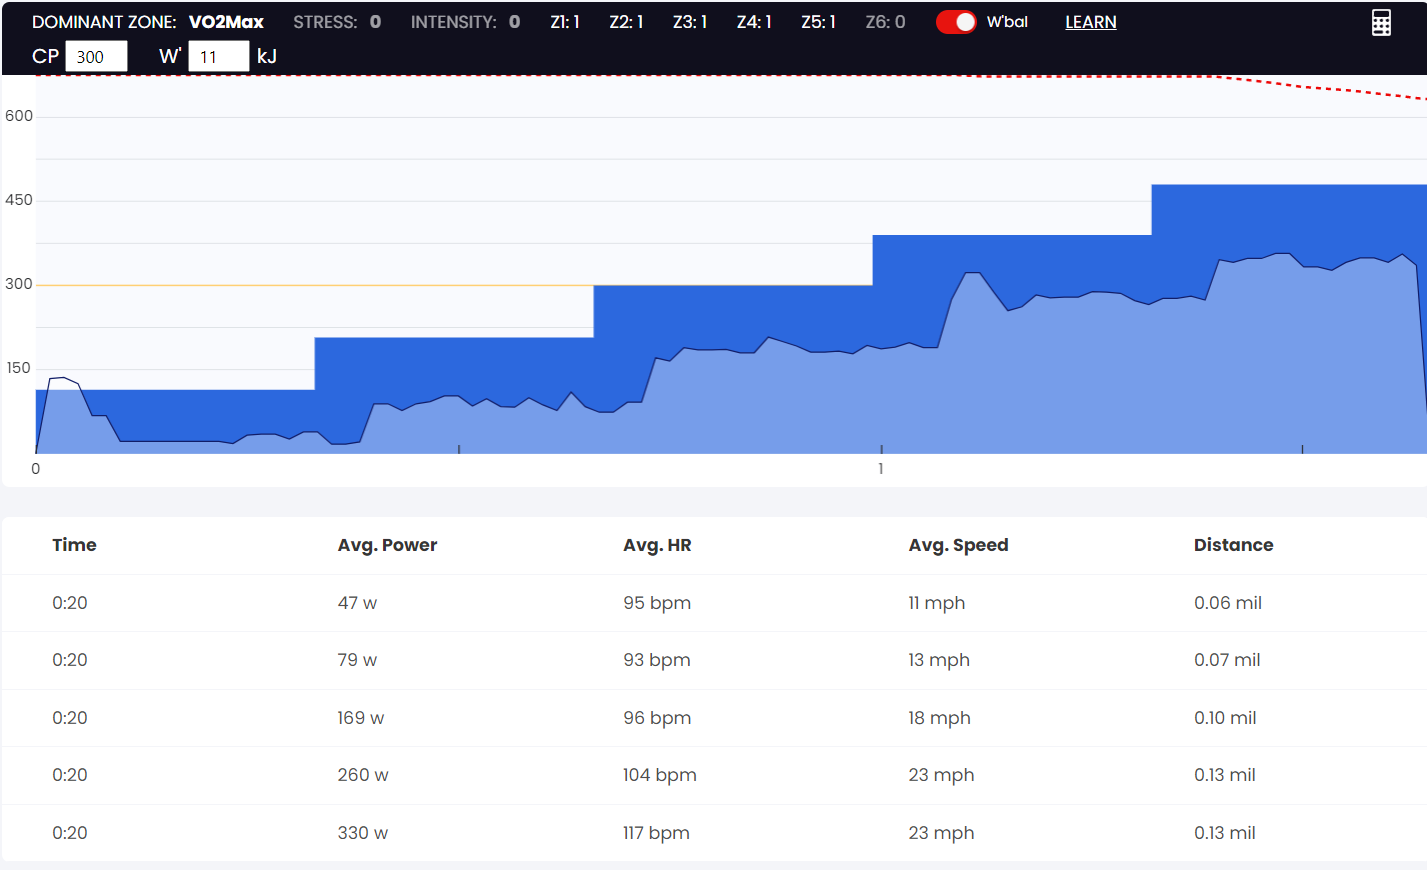
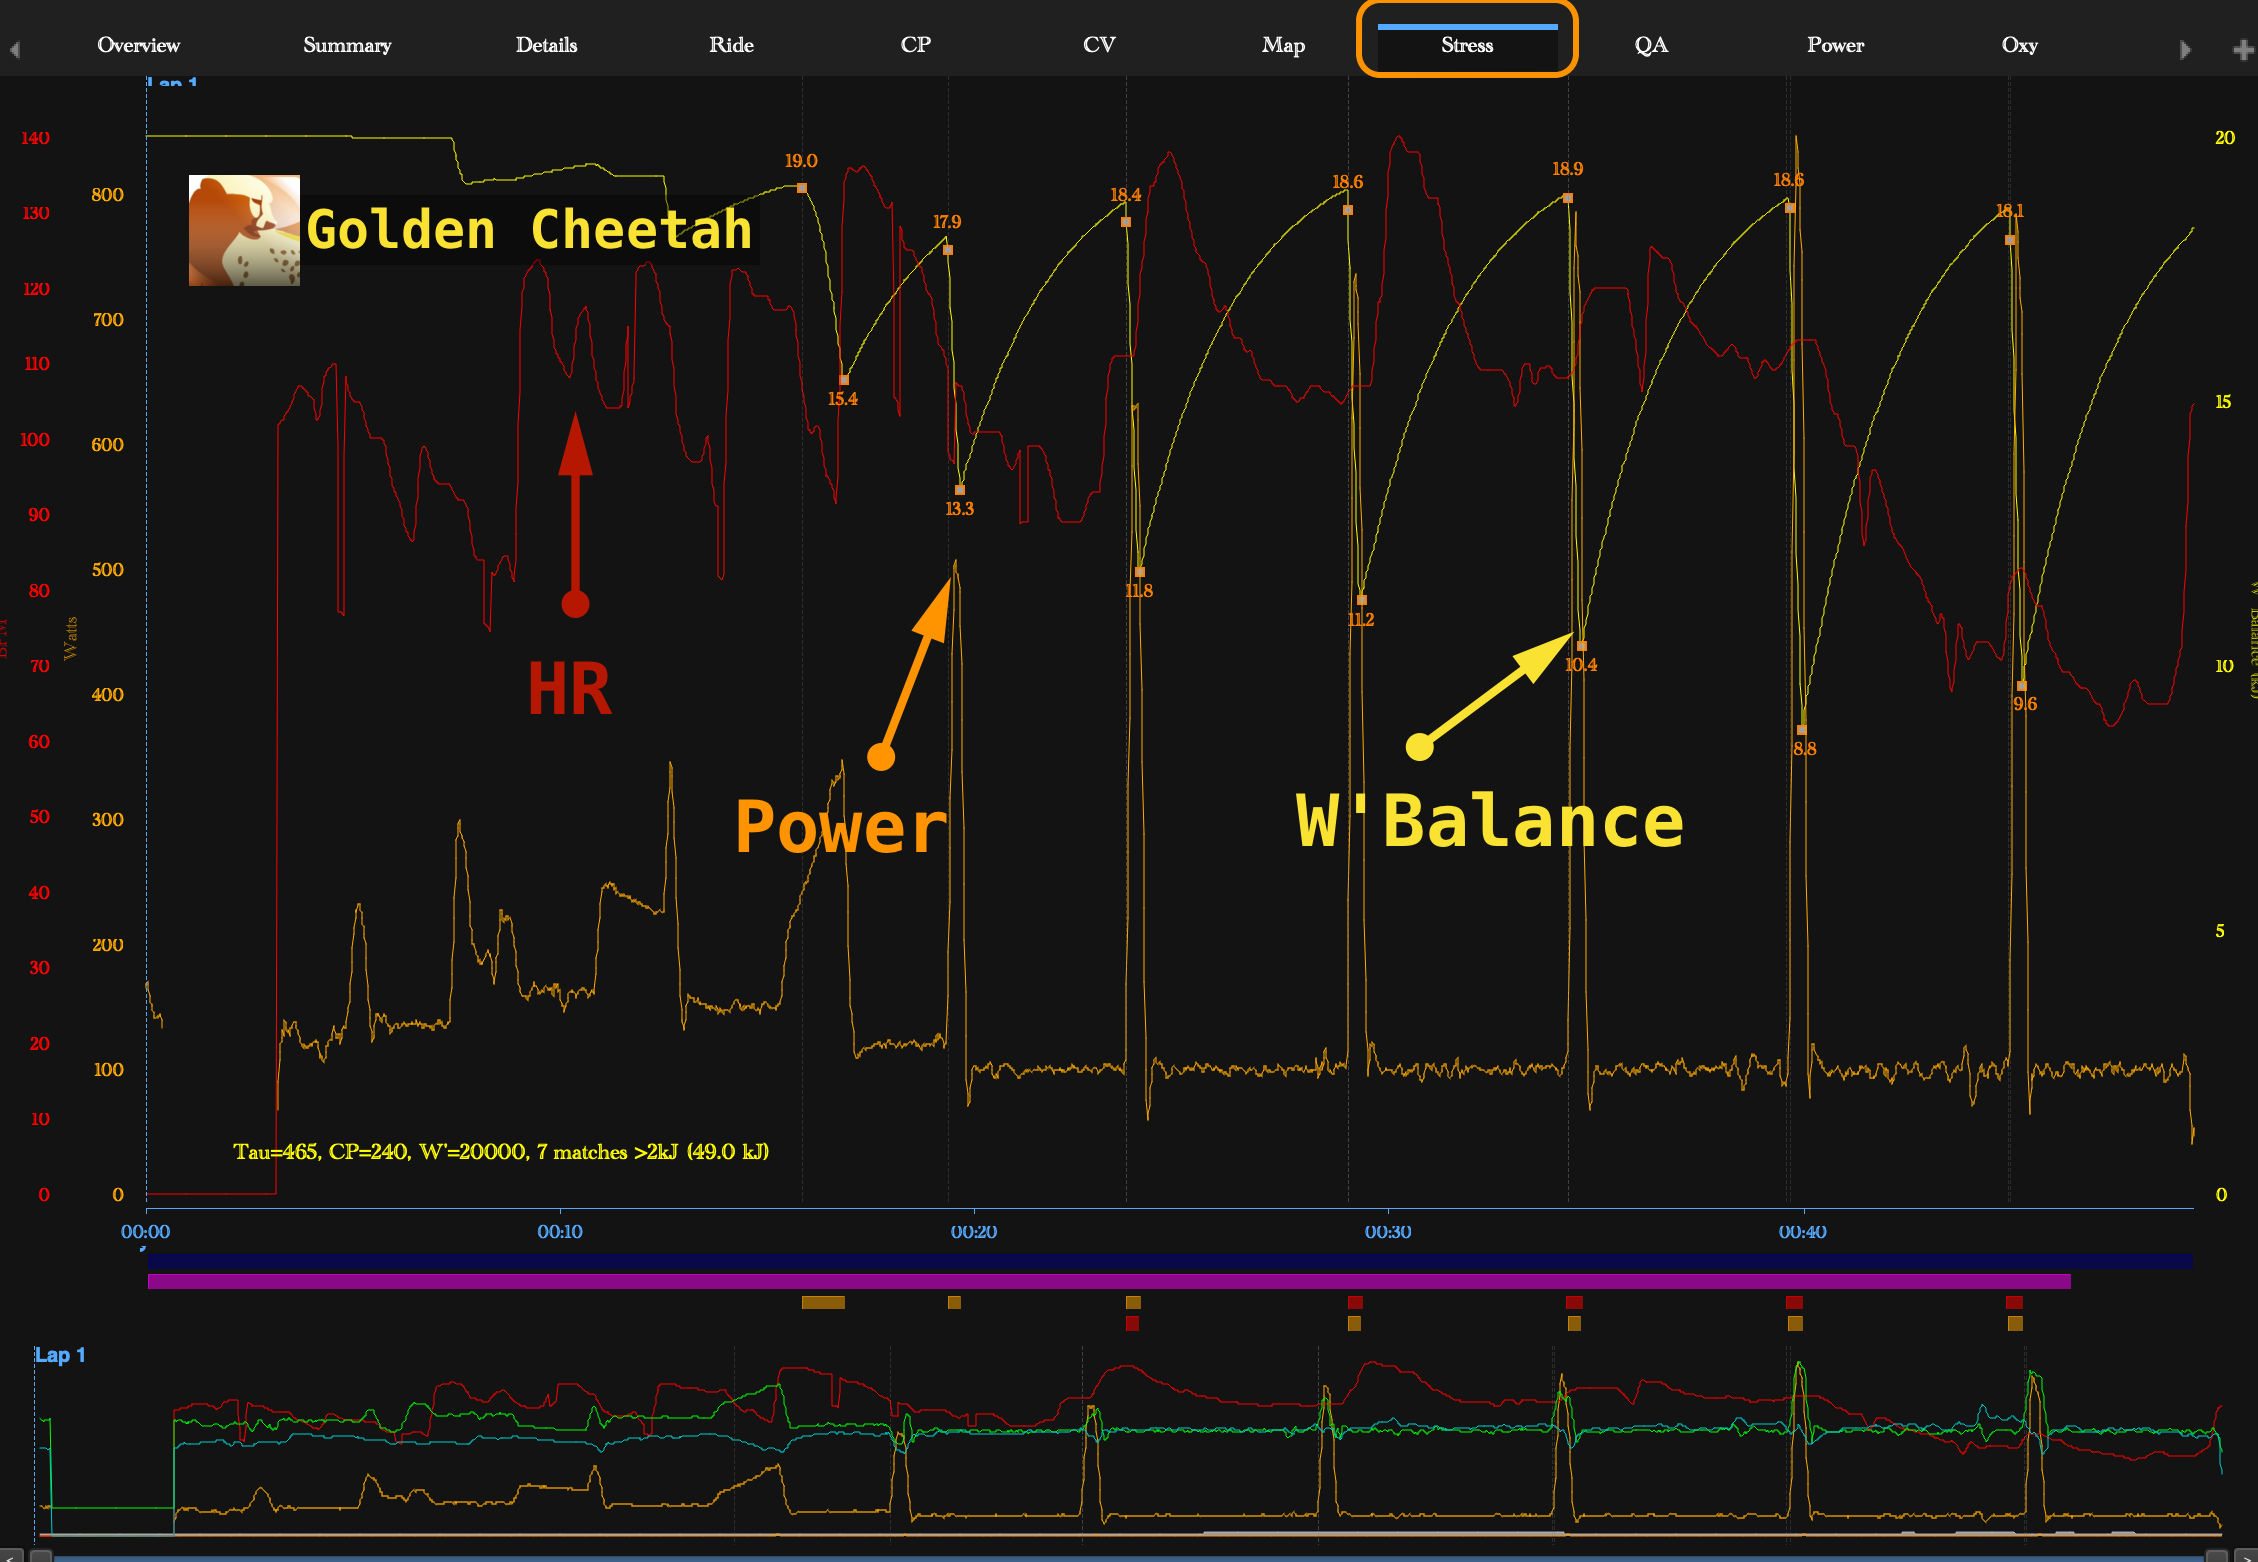
The best way I have found to determine optimal lengths for work and recovery intervals is to use GoldenCheetah.org. Just load it up with TCX or FIT files from your previous workouts. Then look at the Stress report for any given structured workout. Here’s an example:
This report tracks recovery time via the w’balance calculation. It starts at 20 kj and descends below 0 kj when your recovery time is insufficient in a single workout based on power and other factors. In the workout shown here, I am trying to get full recovery between 20 second maximum effort Slope intervals. Textbooks say I need 5 minutes between these types of intervals. Looking at HR and w’bal graphs, I see that I can shorten recovery by about 30 seconds until the last interval creates a w’bal of zero kj. For other VO2 Max over-under workouts, I try to get w’bal to about -10 kj.
GoldenCheetah also lets you monitor the number of aerobic and anaerobic workouts over time. This lets you determine the right mix of endurance and power workouts using TSS and most accepted modelling algorithms. Learn how to use this program and you will build better workouts. Probably better than 99% of coaches too.
Craig our workout creator has W’bal also but yes GC is powerful and more serious. I fully agree FTP based workouts for Anaerobic workouts has the potential to be very inaccurate.
In a simplistic way, I highlighted that fact here.
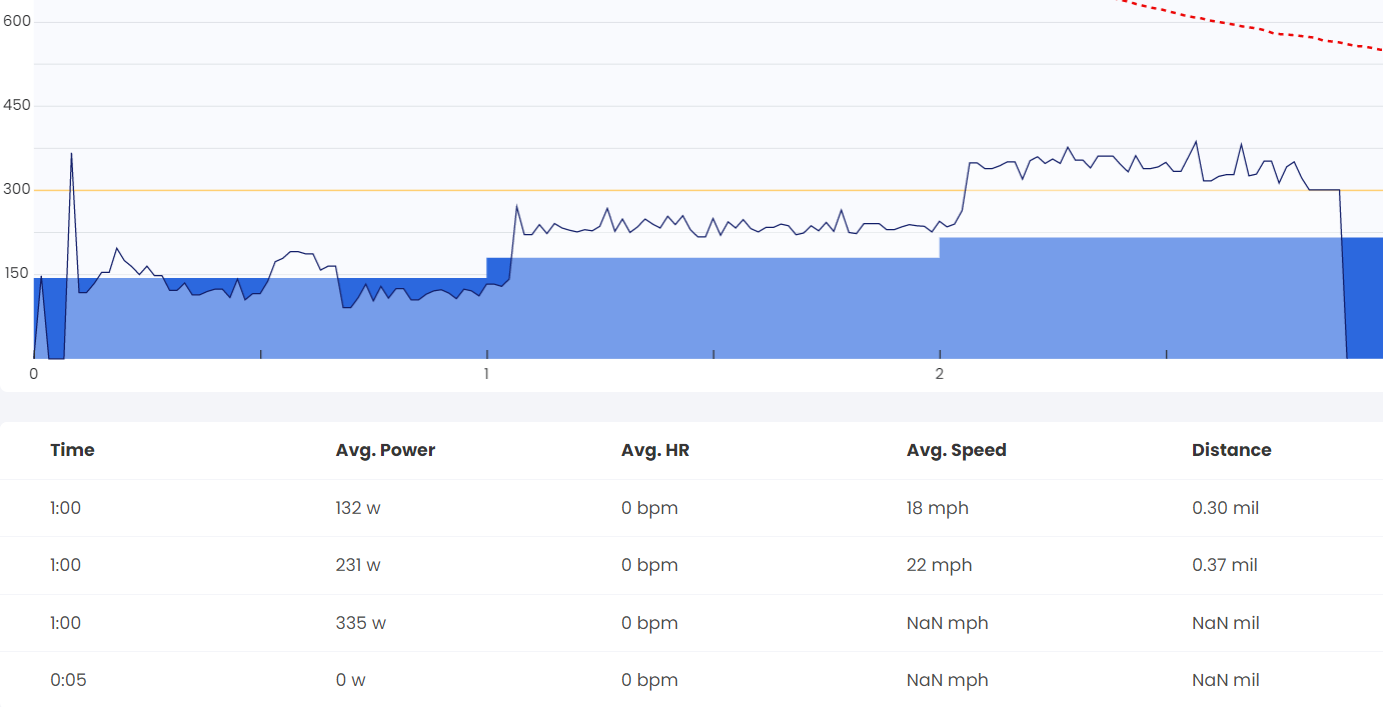
Hey Alex. Just reminder: I can’t do any workout analysis in TrainerDay because it can’t show intervals great than ~2X my FTP. To be able see my HIIT intervals in a workout, I need to significantly inflate my FTP so the graphs are not clipped. TrainerDay does not support a workout like the one shown above . I had to switch to GoldenCheetah last winter so I could analyze my workouts. I think 800w interval targets are appropriate for someone with a 260w FTP in the same way that 1200w is appropriate for some with a 350w FTP. As a senior citizen athlete, I think it’s essential to have occasional “challenging” sets of intervals. Coaches like Joe Friel agree because they have written entire books on the topic. You have classified my workouts as outliers since there are so few examples in your database. I will counter by saying you probably have fewer 63 old riders who are consistently improving. 30% of my indoor workouts have HIIT segments that can’t be shown in TrainerDay.
I have simply moved on to analysis software that supports the occasional hard workout based on my actual FTP. I will certainly consider using TrainerDay for analysis in the future, if and when you can fix this longstanding issue. Cheers.
Oh yes, I did not think about your problem with using our editor. Most people do HIIT as Tabata or similar so 40sec / 20sec which is done around 150% of FTP (see below). But I am guessing your Stages bike begs for shorter intervals and slope mode supports shorter intervals much better than ERG and it’s likely partially a function of habbit and education to do longer intervals. We have a lot of older riders here but still very indoor short sprints are not so popular (yet) and really HIIT in general is not as popular in typical performance cycling. The real sprint work usually happens right before race season which is also done outdoors. So overall as far as I can see this is still an outlier case but something I do hope grows in popularity and I hope to support it better.
It’s actually much simpler than you describe: A certain number of workouts should include short intervals “as hard as you can pedal”. Joe Friel and others describe the value and recommend recovery between at 5 minutes. As the rider progresses, you can increase power target or length of work interval. It’s nothing more than this.
The target is “as hard as you can pedal”. It requires slope mode where pedalling harder produces more watts for the target resistance level. The upper limit for each rider will be different. It has little to do with FTP although 300-400% is typical with riders that I work with. I have never found any rider who cannot exceed 200% FTP in this drill.
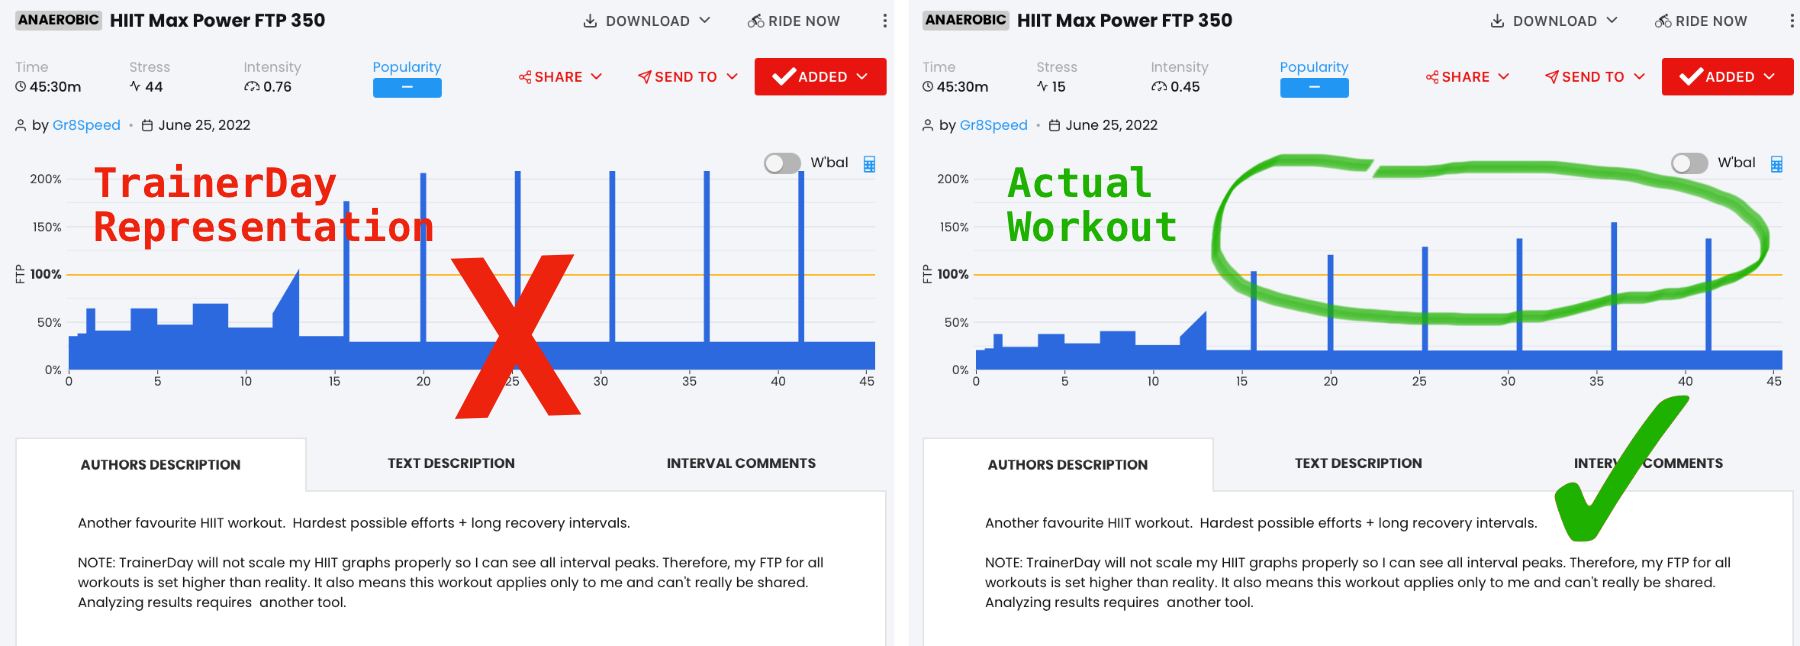
Here’s what this workout looks like in TrainerDay. You see this rendering in summaries and while actually doing the workout. The critical peaks are clipped and not visible. You have rationalized that this is OK since the scales for each graph would otherwise be different. In the BI business, we compare charts all the time. Users insist on full graphs versus fixed scales. I don’t see why cyclists would be different.


 . To get it, I simply record power numbers for 3 or more different slopes at a fixed gear and cadence. BTW: to better control cadence I use a metronome app on my phone.
 . I had to switch to GoldenCheetah last winter so I could analyze my workouts. I think 800w interval targets are appropriate for someone with a 260w FTP in the same way that 1200w is appropriate for some with a 350w FTP. As a senior citizen athlete, I think it’s essential to have occasional “challenging” sets of intervals. Coaches like Joe Friel agree because they have written entire