Thank you, I would very much like to have this. Just for the purpose of trying to match my power number on the app to the power asked for by the training session. It just jumps around too much. I don’t really care about the graph in the end, it’s just a real-time thing for me.
+1 to power smoothing being something that would greatly improve the experience within the app.
Real time the number jumps around like crazy which is unideal.
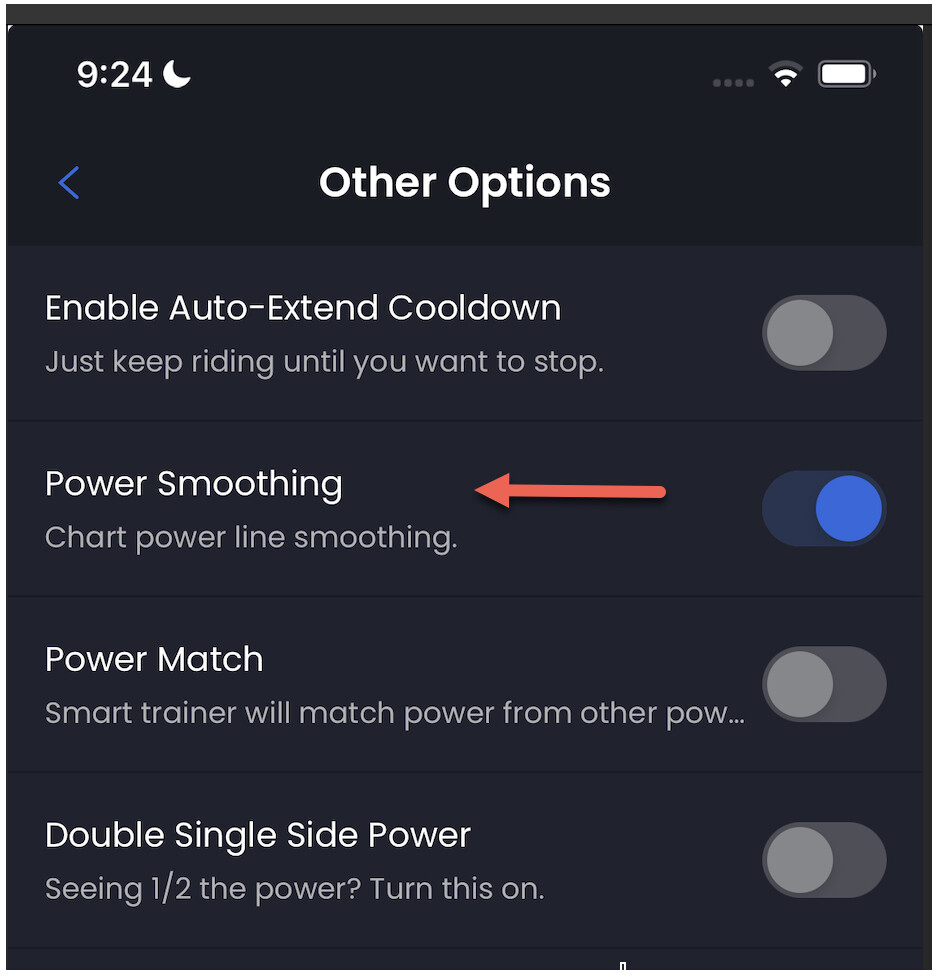
Ok todays new version, we don’t have the slider but we did add a more powerful smoothing option in other settings. My Wahoo device is already smooth so I can’t tell how much this helps you guys. I also realize I am not 100% sure if it smooths the Watts field but I am pretty sure it does.
2 Likes
Hi Alex,
I get the impression that this smoothing of the power graph doesn’t work. Maybe it’s just trainer thing.
These graphs are after the introduction of the power smoothing function.
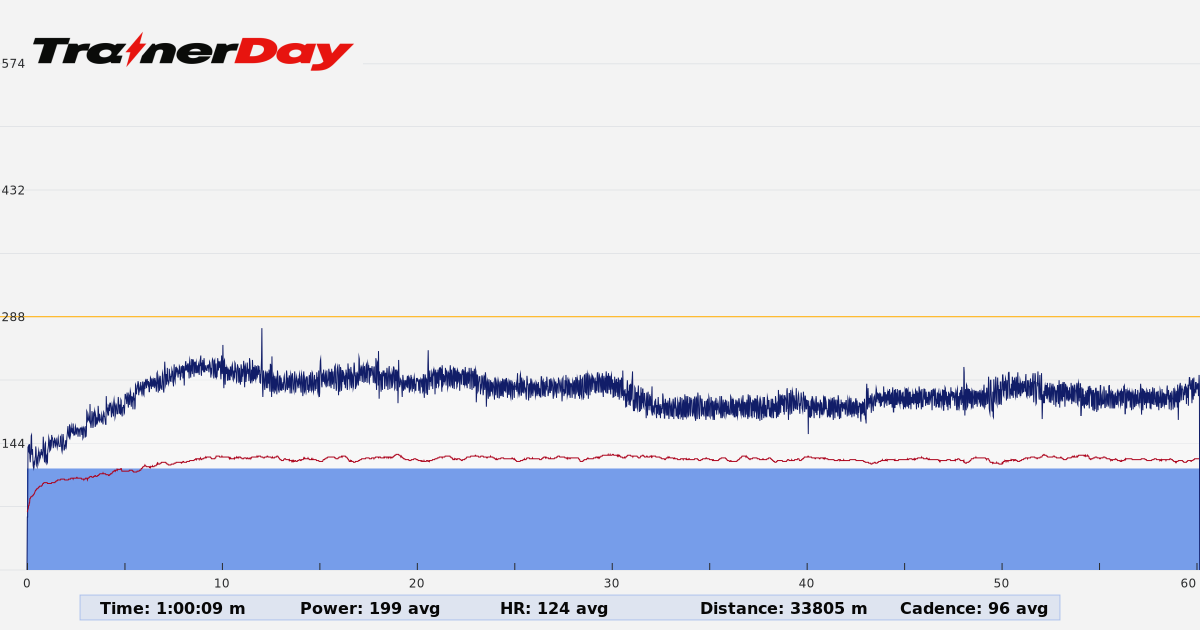
This graph is before the introduction of the power smoothing feature.
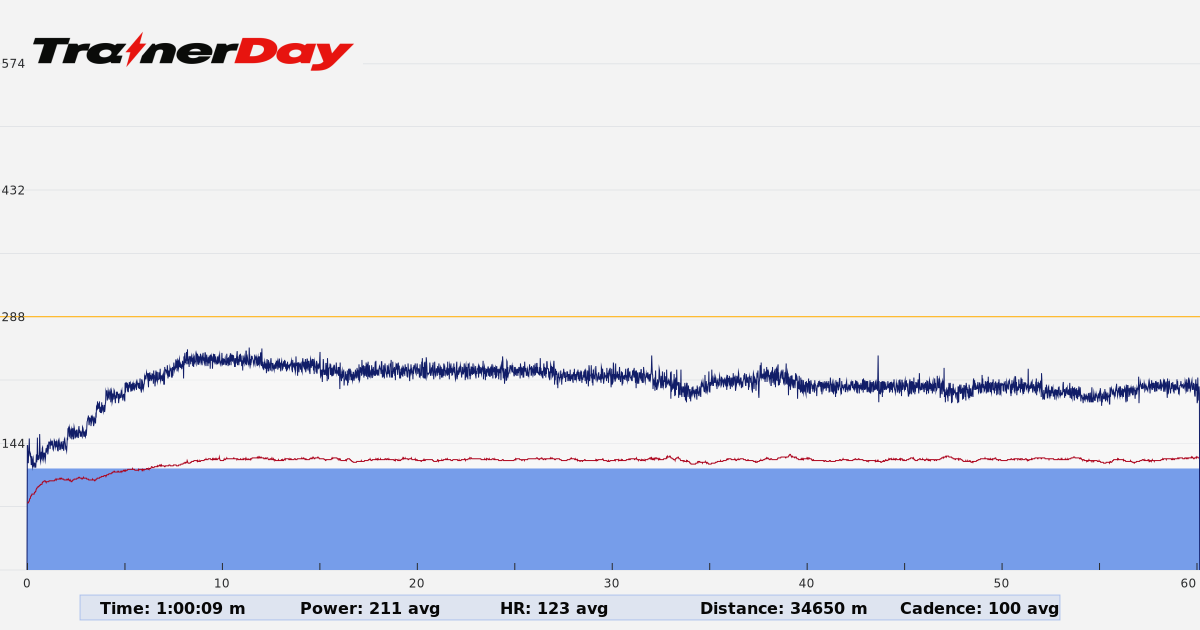
Looking at them, I get the impression that the one from before the introduction of the power smoothing function is smoother.
Couldn’t a power chart look similar to an HR chart?
What TD calculates under the hood is fine, but can’t this graph be more approximated?

The website still has raw data. It’s only in the app. We will add to website as well. Take screenshots from the app during training that is mostly what we are focusing on at first. I don’t see how web could change but would need to ask my developers.
Power can be as smooth as HR as long as you pedal as smooth as your heart beats 
Wahoo has incredible power smoothing but supposedly they cheat in ERG mode a little.
It’s a shame that you can’t see cadence on PNG exports. Then you would be able to see how fairly even the rotations are.
There must be something to it.
But you have to admit that smooth lines almost glued to the blocks look nice. ![]()
I’ve noticed that it’s just getting smoother when I give e.g. +10s. I.e. from start to extension.
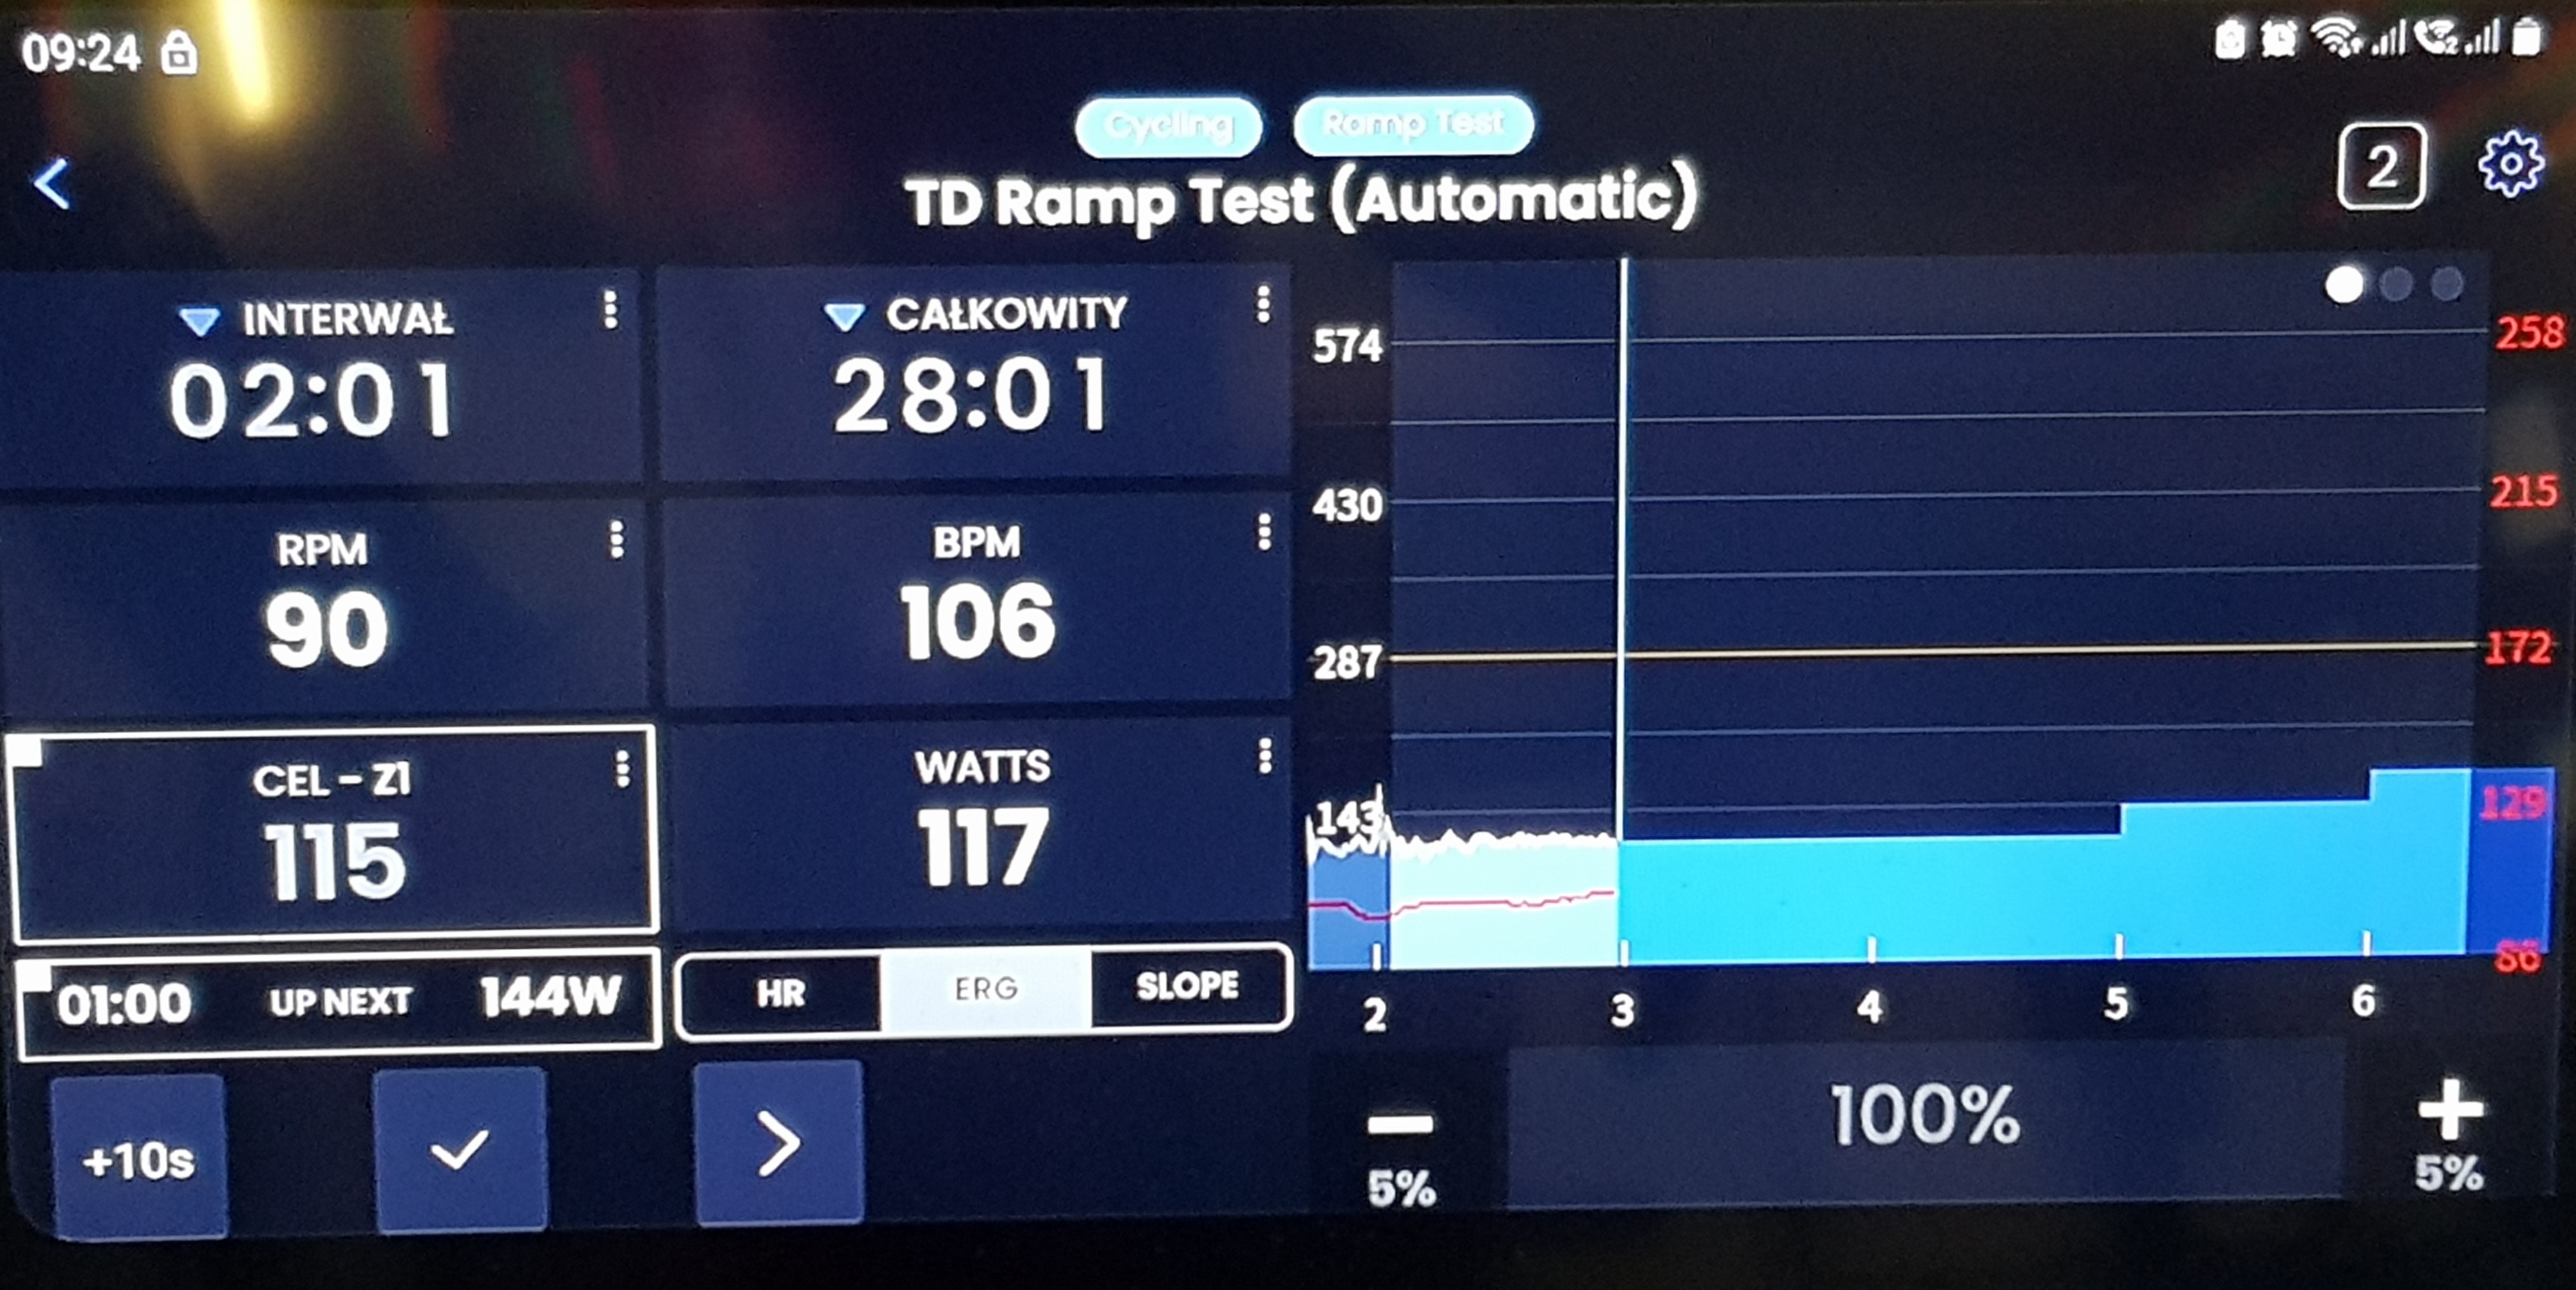
I’m going to try to take a screenshot during a workout. ![]()
In general, it’s good, tomorrow I’ll do a ramp test, on Tuesday I’ll start with the plan. ![]()
The nature of Power and the way it is measured (with a real powermeter), is that it isn’t smooth. Power jumps around a lot, because of slight differences during the pedal stroke. Everyone with a real power meter, has a 3sec or higher smoothing applied to visualise the value on his recording device. If you apply higher smoothing time, it becomes disturbing when doing sudden surges.
Power from trainers is not ‘real’ power, as in ‘measured’. Some trainers just show you what has been sent as a target and don’t do any kind of measurement. Those look rock-steady. Others return the speed/power conversion they all use, and that has some jumping around, but usually less then the Power value measured with a real power meter.
If you have a smart trainer and a real Power meter, the last one is what is shown and is what is most jumpy.
You get used to that view after a while. On my Garmin device, I have 2 fields for power, one with 3 sec smoothing and one with 10 sec smoothing. The last one is what I look at the most because it gives me an idea what my sustained power is at that moment. But at the start of an interval, I don’t want to wait 10 sec before I can see if I’m overdoing it or not…
The utmost important thing, is that it is recorded without smoothing. The way you view it afterwards, is your decision.
I invented a new form of smoothing, but it seems like it still needs some optimization that it dynamically changes the smoothing duration range. Bigger changes it reduces to 2 second smoothing and small changes it goes out to 10 second smoothing. But still it seems it needs some optimization, maybe in the threshold between what gets 2 seconds, 4, 6, 8 or 10 second smoothing.
Yes smooth lines look nice. TR is better at this. @conti if you send me one of your files I can work and see if I can tweak it a bit. Just send me a link here to one of your completed activities.
I can consider cadence to the image but also we will apply smoothing to the website first.
1 Like
Hi @Alex ,
at your request, I am sending you a link to my activity:
https://app.trainerday.com/activities/6567650dc1f9334efba3164e
6567650dc1f9334efba3164c.tcx (1.6 MB)
And now my observations after today’s test.
The smoothing can be seen beautifully after applying the zoom.
An interesting thing I noticed when I took this picture:
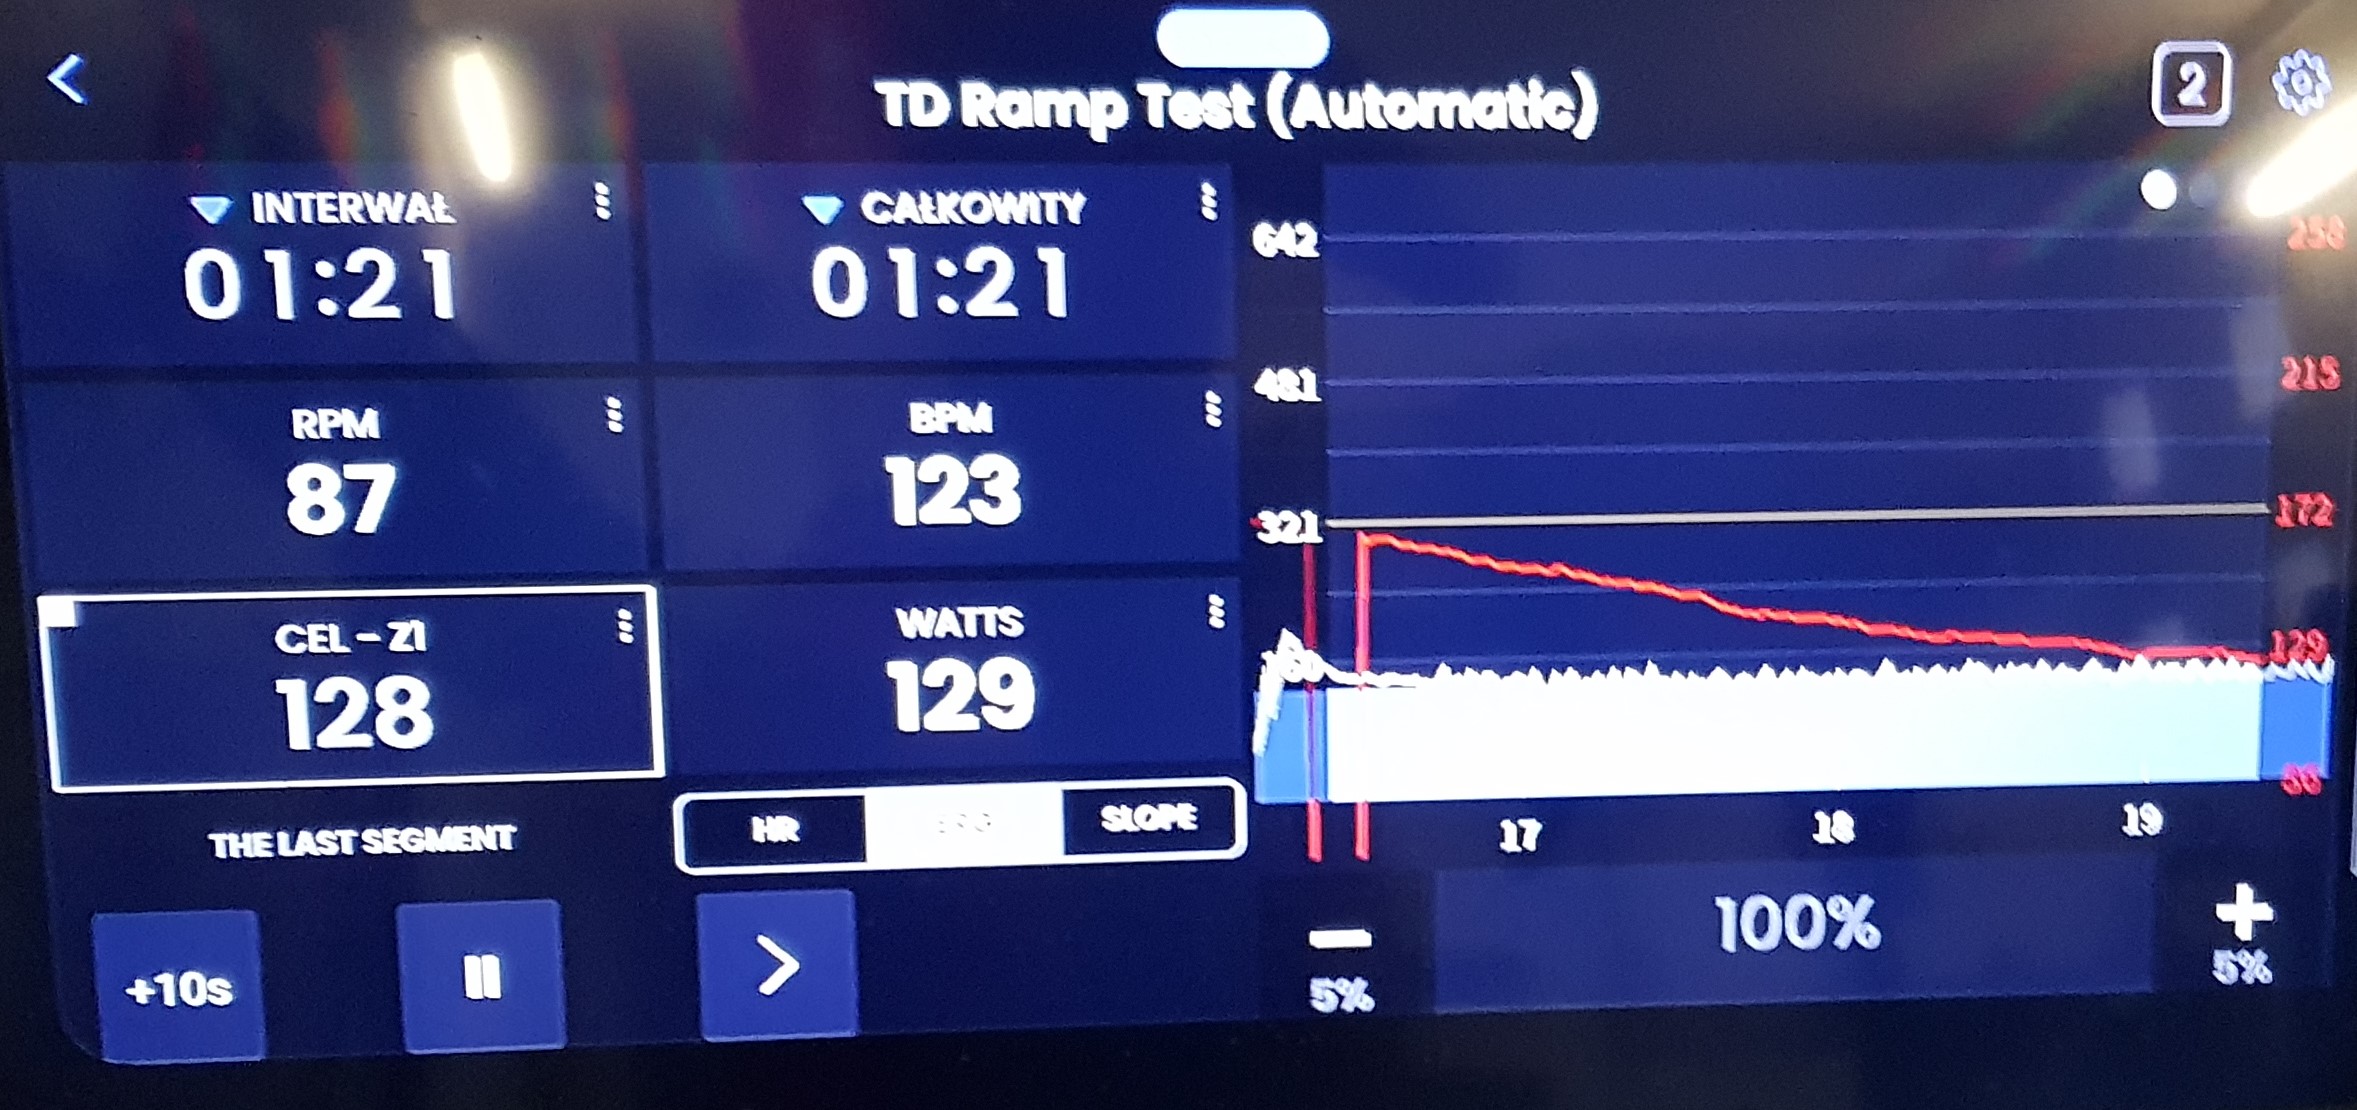
I put the phone down by touching the phone that was running the TD app, and a window with sensors popped up. When I removed this window, the screen seemed to refresh and the graph smoothed out amazingly.

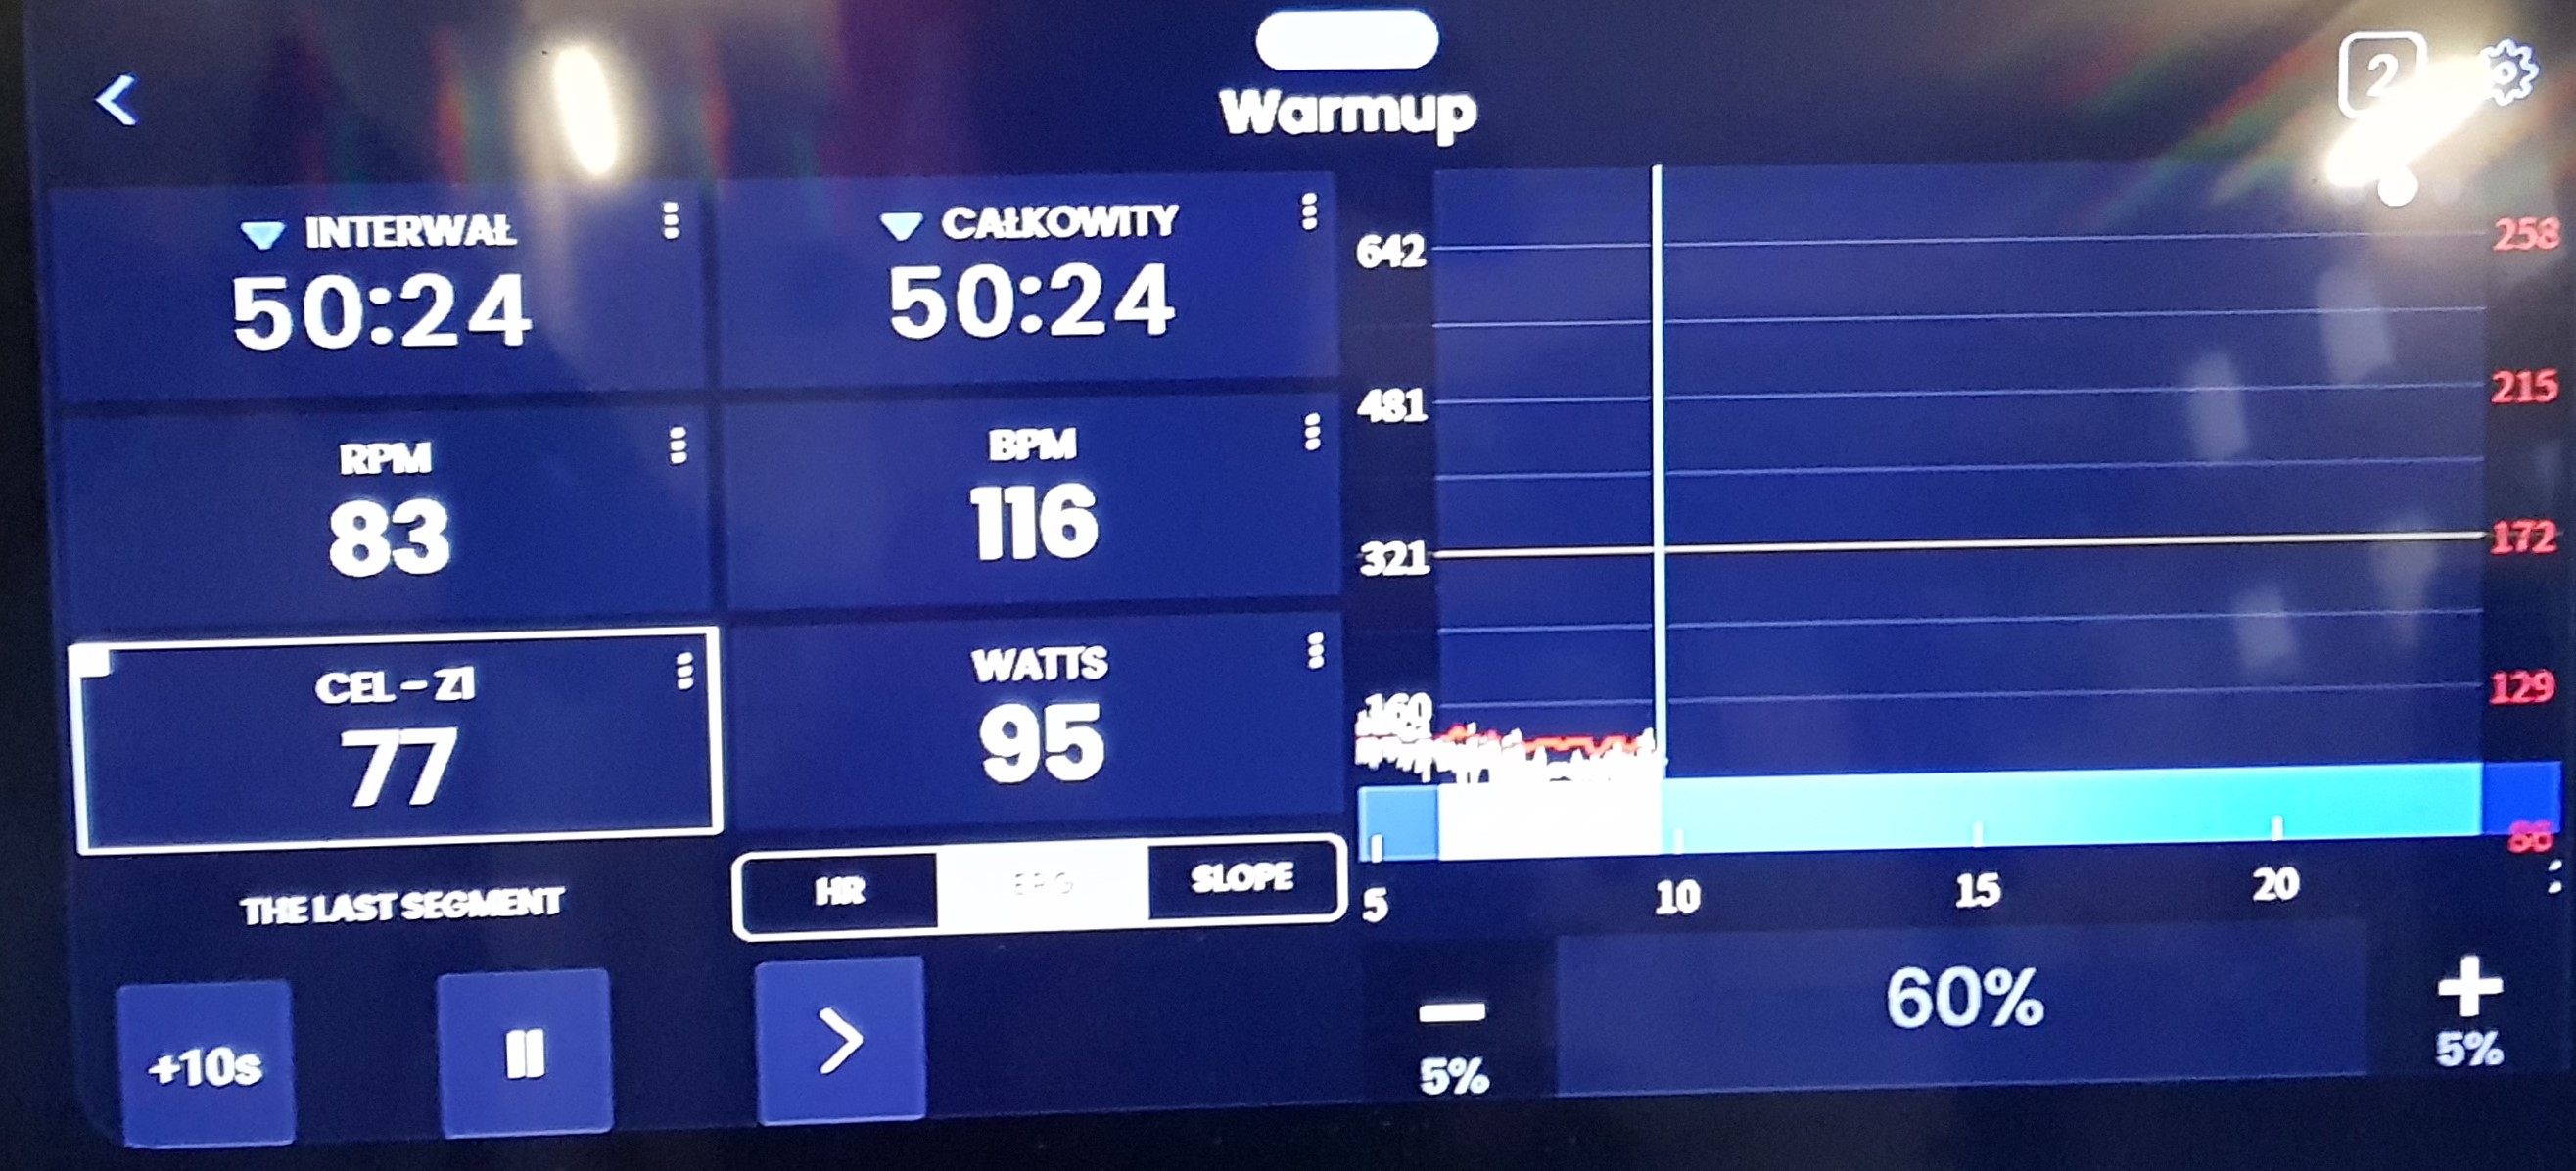
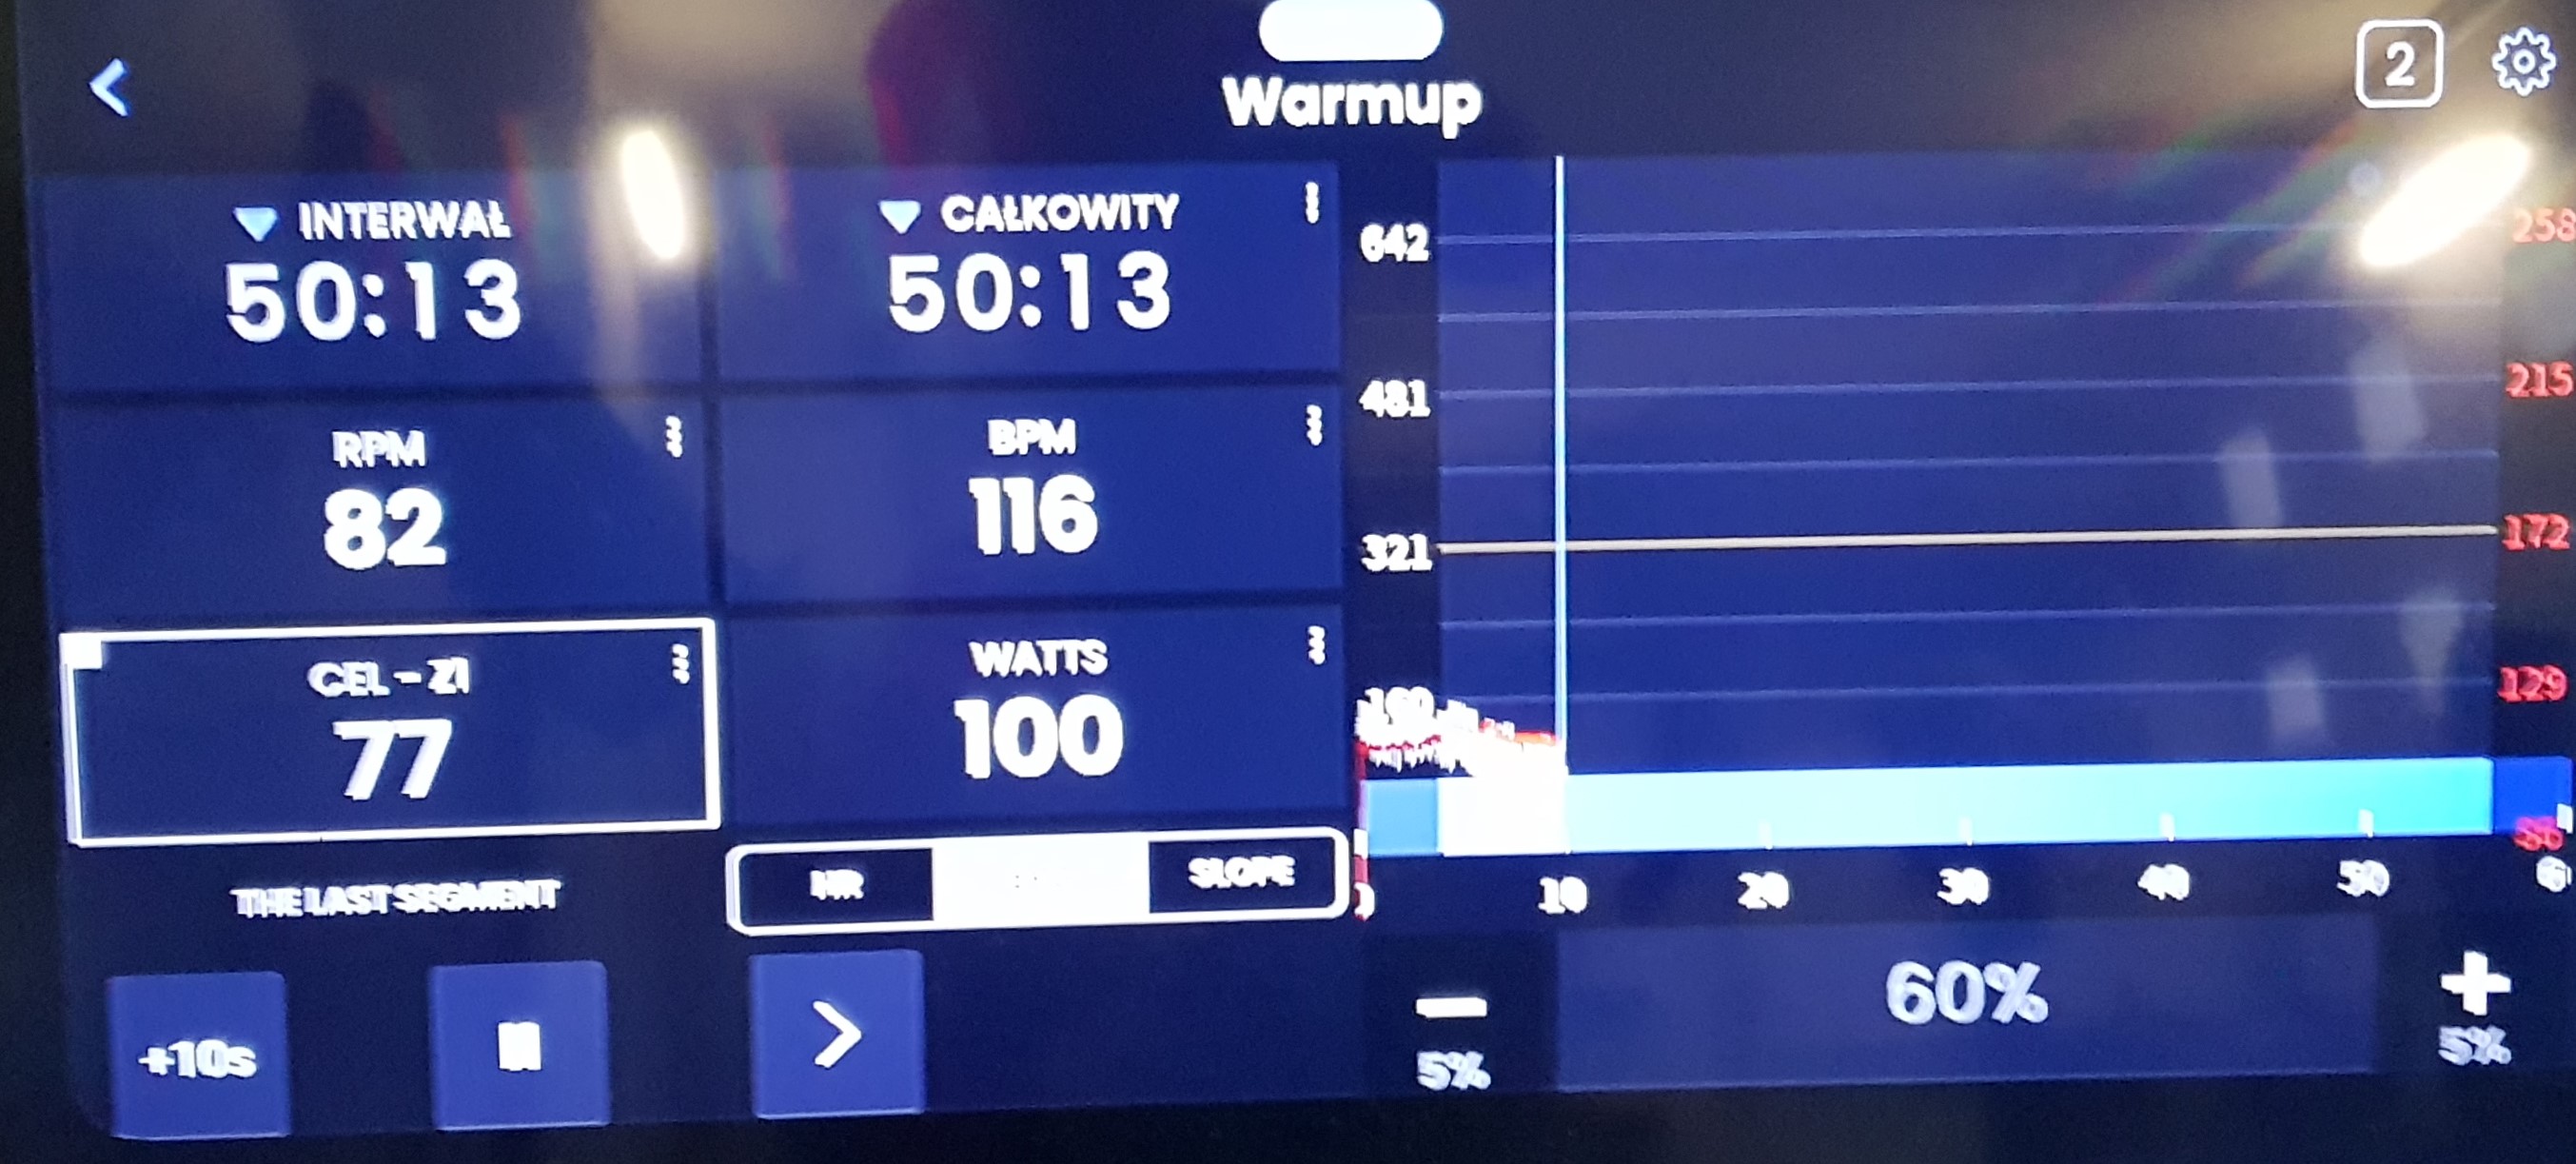
This is what the graphs look like at different zooms:

I didn’t want to list it. ![]()
I will nominate you for the Nobel Prize for what you do. ![]()
![]()