Watts on y-axis capped at 225w? (Feature request is to allow wider range on history)

Hi,

I paired TrainerDay to an ic4 and I’m using the app on my google pixel phone. The app is great, but I feel like I’m missing a setting somewhere and/or I just don’t know how to use the app and/or maybe its a feature related the unpaid version (I haven’t started paying yet, trying out the app to make sure it suits my needs.)

Anyway, so far I have only used the “quick start” feature just to track my numbers while I follow a peloton video/workout. The y-axis for watts always seems cut off at around 250 watts. The attached screenshot from my saved activities does the same. Any reason why this is happening? Anything I can do to see the full scale?

Hi, you FTP is set at 100. Take an FTP test and set it accurately. For now just set it to 200, I am not sure if this will fix workouts you did.

Yes we cap at about 215% of FTP. If you do very high short durations and it is capped you can sync to Strava for free and see the full scale for example.

If you need more information about FTP tests and such let me know.

1 Like

I was going to report this as a bug.

Most of my 30 second intervals are 225% FTP and higher. 10 second intervals are 400%.

Any chance you can fix this display problem? I have to import all my workouts to garmin.com to look at the results :frowning:

okay, great, thanks. I’ll set FTP to something higher. I don’t really care about previous workouts, but if this hack works moving forward that’s great. Thanks!

It’s not really a hack because 99% of riders that regularly go over 350w have an FTP of greater than 175. My guess would be your FTP is not 100. Craig above is more rare that he does very short duration sprints on an indoor trainer.

It’s not a bug from our perspective because it was designed this way on purpose so all workouts are on the same scale and FTP line is in the middle. So this would be a feature request. :slight_smile: Craig are you asking for this only on the activity history page in website? We could add it there possibly but changing it everywhere would cause more harm than good in my opinion. Craig you could use something like free TrainingPeaks and automatically sync it there for now.

If it were up to me, I look at the maximum watts produced in the session before showing the graph to determine the correct scale. That’s how every other product seems to work.

Here’s the same graph uploaded to the Garmin site.

I don’t understand why 215% of FTP is a significant threshold. When you look at graph above, all the interesting data is cut off.

The last six intervals in this workout are slope intervals. The goal is push as hard as you can. Unlike Erg mode, exceeding the target is how you ultimately demonstrate improvement. You do the same workout for multiple sessions. You only increase the slope targets when you have exceeded the target watts by pedalling harder than prescribed.

These are the same workouts we used with the Canadian national team 40 years ago. They are still used today.

Actually I believe you are talking about analysis products. When you look at products like TrainerRoad or ones that are showing an overlay of the completed activity on top of the planned activity from what I have seen they all keep the scale consistent. Otherwise the same workout looks very different in different places. Since very few people do these short intervals it benefits very few. You are the first to say anything… And most people use other tools for analysis. One thing that might satisfy you and others is to bring a Strava like view on to this page in addition to what you see.

I am just thinking aloud right now. It sounds like you are only talking about the history page and not during the workout in the app. Some times people might have like a 1,000w spike and all of a sudden (error or not) it throws the whole scale off so that you can hardly see your workout is changing.

1 Like

I changed my FTP from 240w to 400w to solve this problem. I can now see my power plots in the app during a workout and when reviewing activities online. Other recommendations must now be ignored but seeing my power graphs is more important to me.

Suggestion: Instead of 215% of FTP, why not use 120% of the highest interval specified in the workout? That will give you a constant y-axis and leave room for riders to exceed their planned effort in a slope workout.

Craig yes your changing FTP solution is fine. The problem is if you try to share a workout with someone it will be a very easy workout for them when you are doing a hard one yourself and screenshots will look strange but on a personal level it is fine.

Let me show you two workouts both following your 120% idea. You can see the 100% line does not even show up for Z2 and Z3 rides and these workouts look identical even though they are fairly different.

And if we look at your workout similar to your both ways the one on the left looks much harder than the one on the right at first glance. This makes it so it is much harder to quickly visually compare and understand workouts.

Does this make my point obvious? Again you are the only one asking for this although I fully appreciate and understand the problem. My soution proposed above like Strava does it or similar solves this problem of at least being able to visually see the actual watts you hit.

Below is how TrainingPeaks shows it which would be fine as well.
image

Alex, I completely understand that changing FTP invalidates just about every metric and zone prediction. Rest assured, with an invalid FTP, I can’t even share the workout with myself since all power settings change with FTP. I need to copy the entire worksheet, change the FTP value and then paste cells back. Not a good experience - but that’s what I must do if I want to review my results.

One of the nice things about TrainerDay is your tag line: “Train your way, not someone else’s”. I am going to say something you probably will not agree with: FTP is far too blunt a metric for building training plans.

FTP is a useful starting point - including for sharing a workout - but changes must be made to optimize both effort and recovery for individual riders every day. To do this, I need to see all the data.

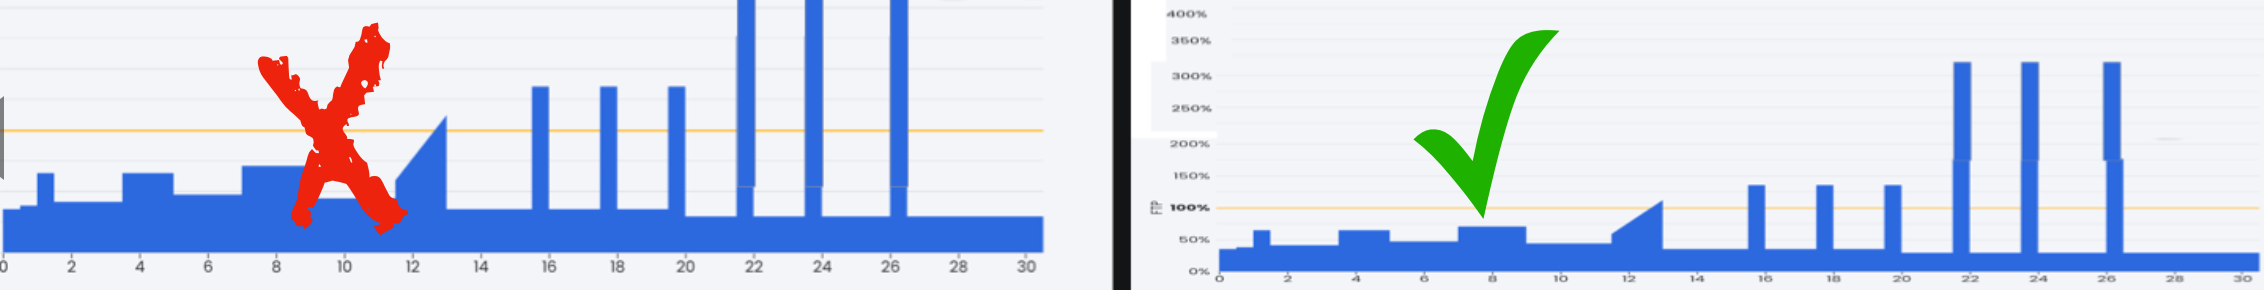
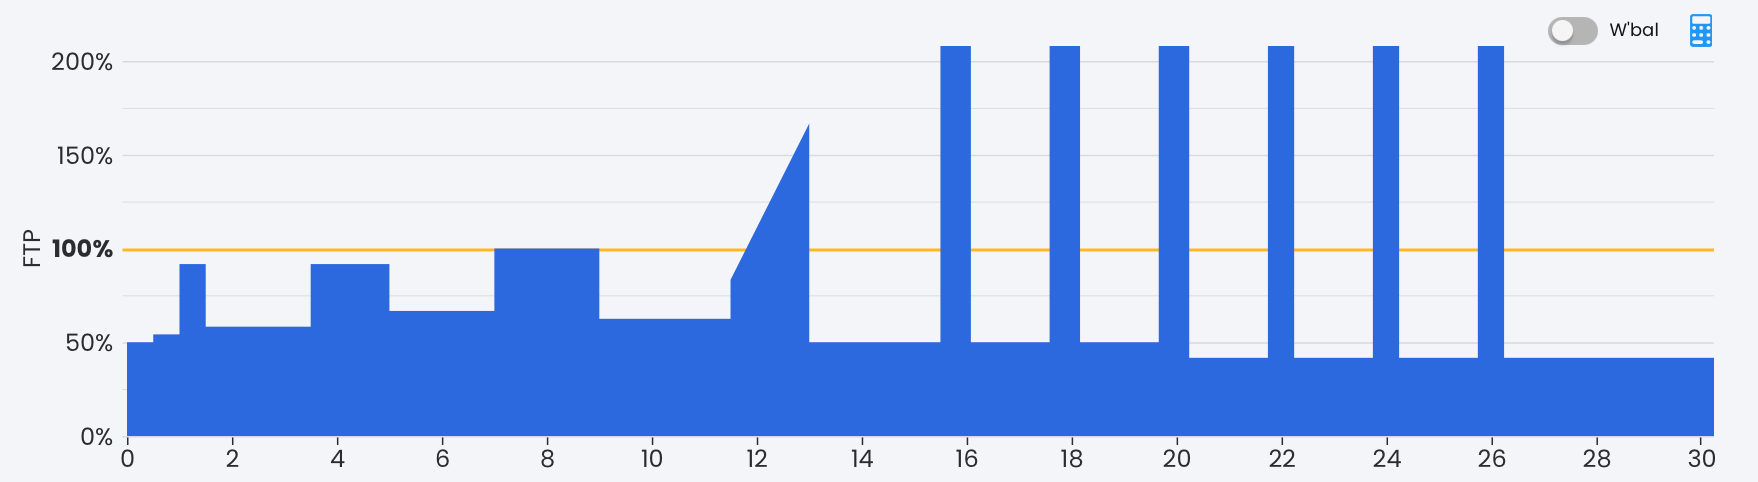
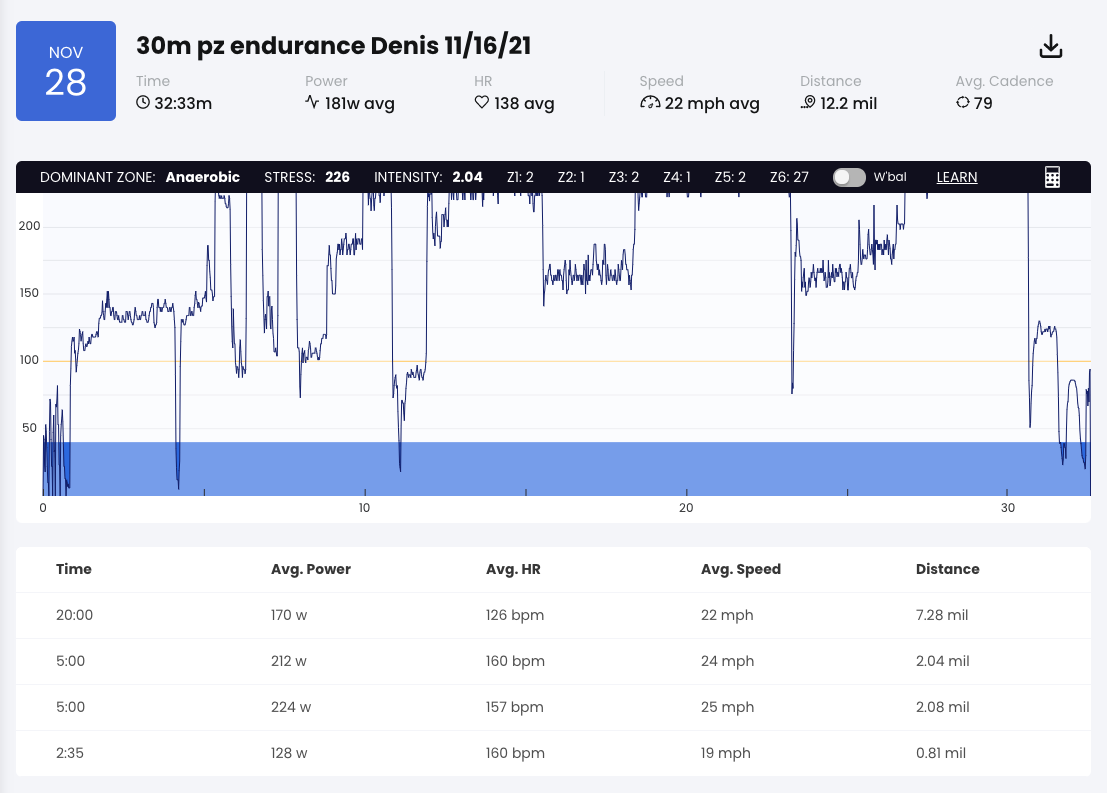
Looking at these graphs, #1 tells me nothing. Only #2 is of value. I can see the scales, so I don’t agree that one looks harder than the other. I have worked in the Bi industry for 30 years. We do user tests on this all the time. Graph #2 is the only one that users accept.

We all know that HR integrated against power is a key trailing indicator of performance. This calculation cannot be derived from FTP alone - yet we seem to have an entire exercise industry build around this premise!

As I have said many times, these concepts are not new. Prior to Andrew Coggan, FTP and power meters, we had the Conconi Test, HR and lactate lab measurements. Some people think this technique is invalidated by FTP. That’s partially true (thanks to power meters) with one significant exception: HR measurements are needed to fine-tune a workout once you have got the basics right with FTP.

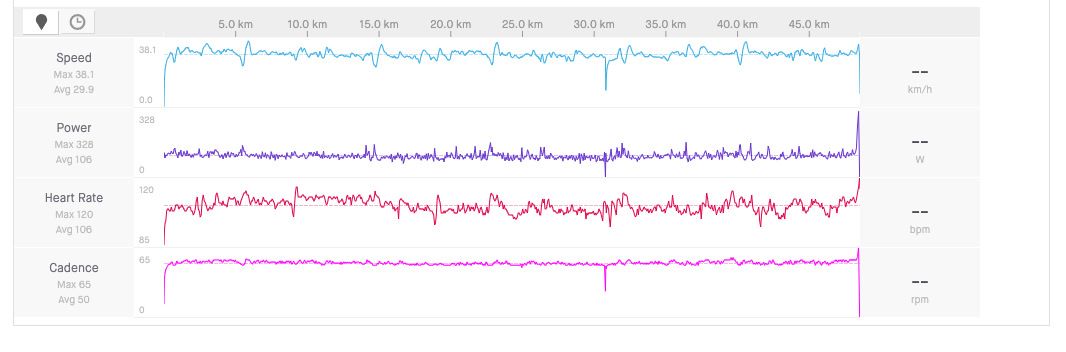
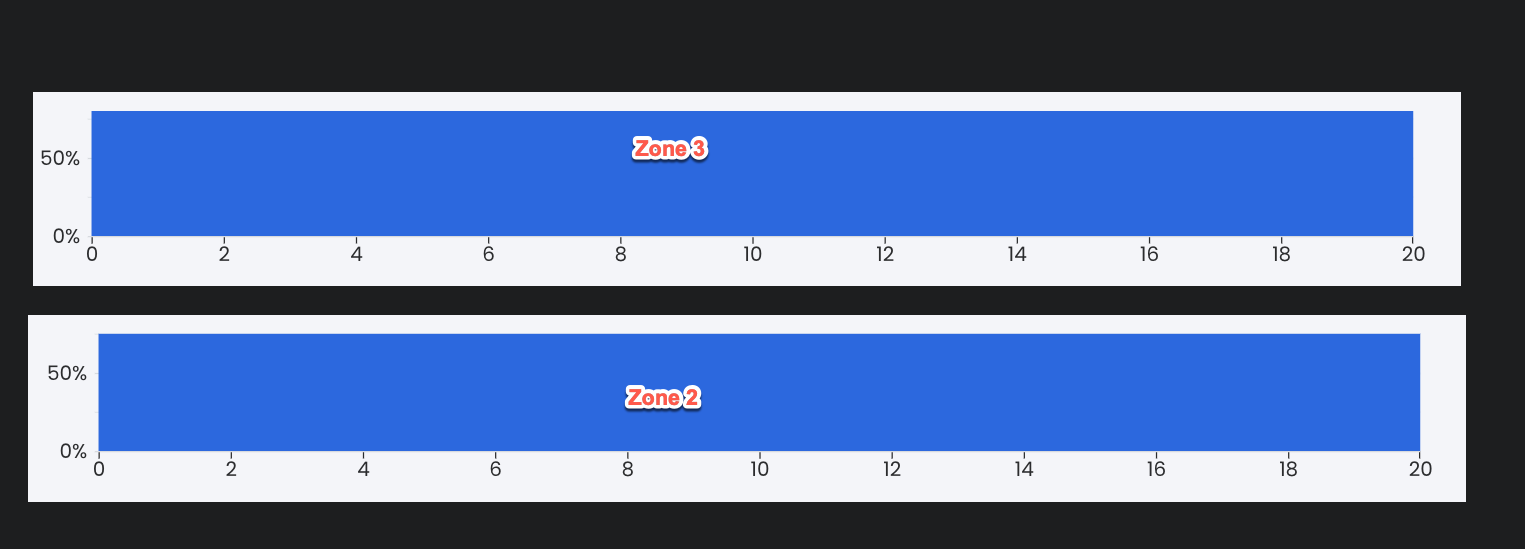
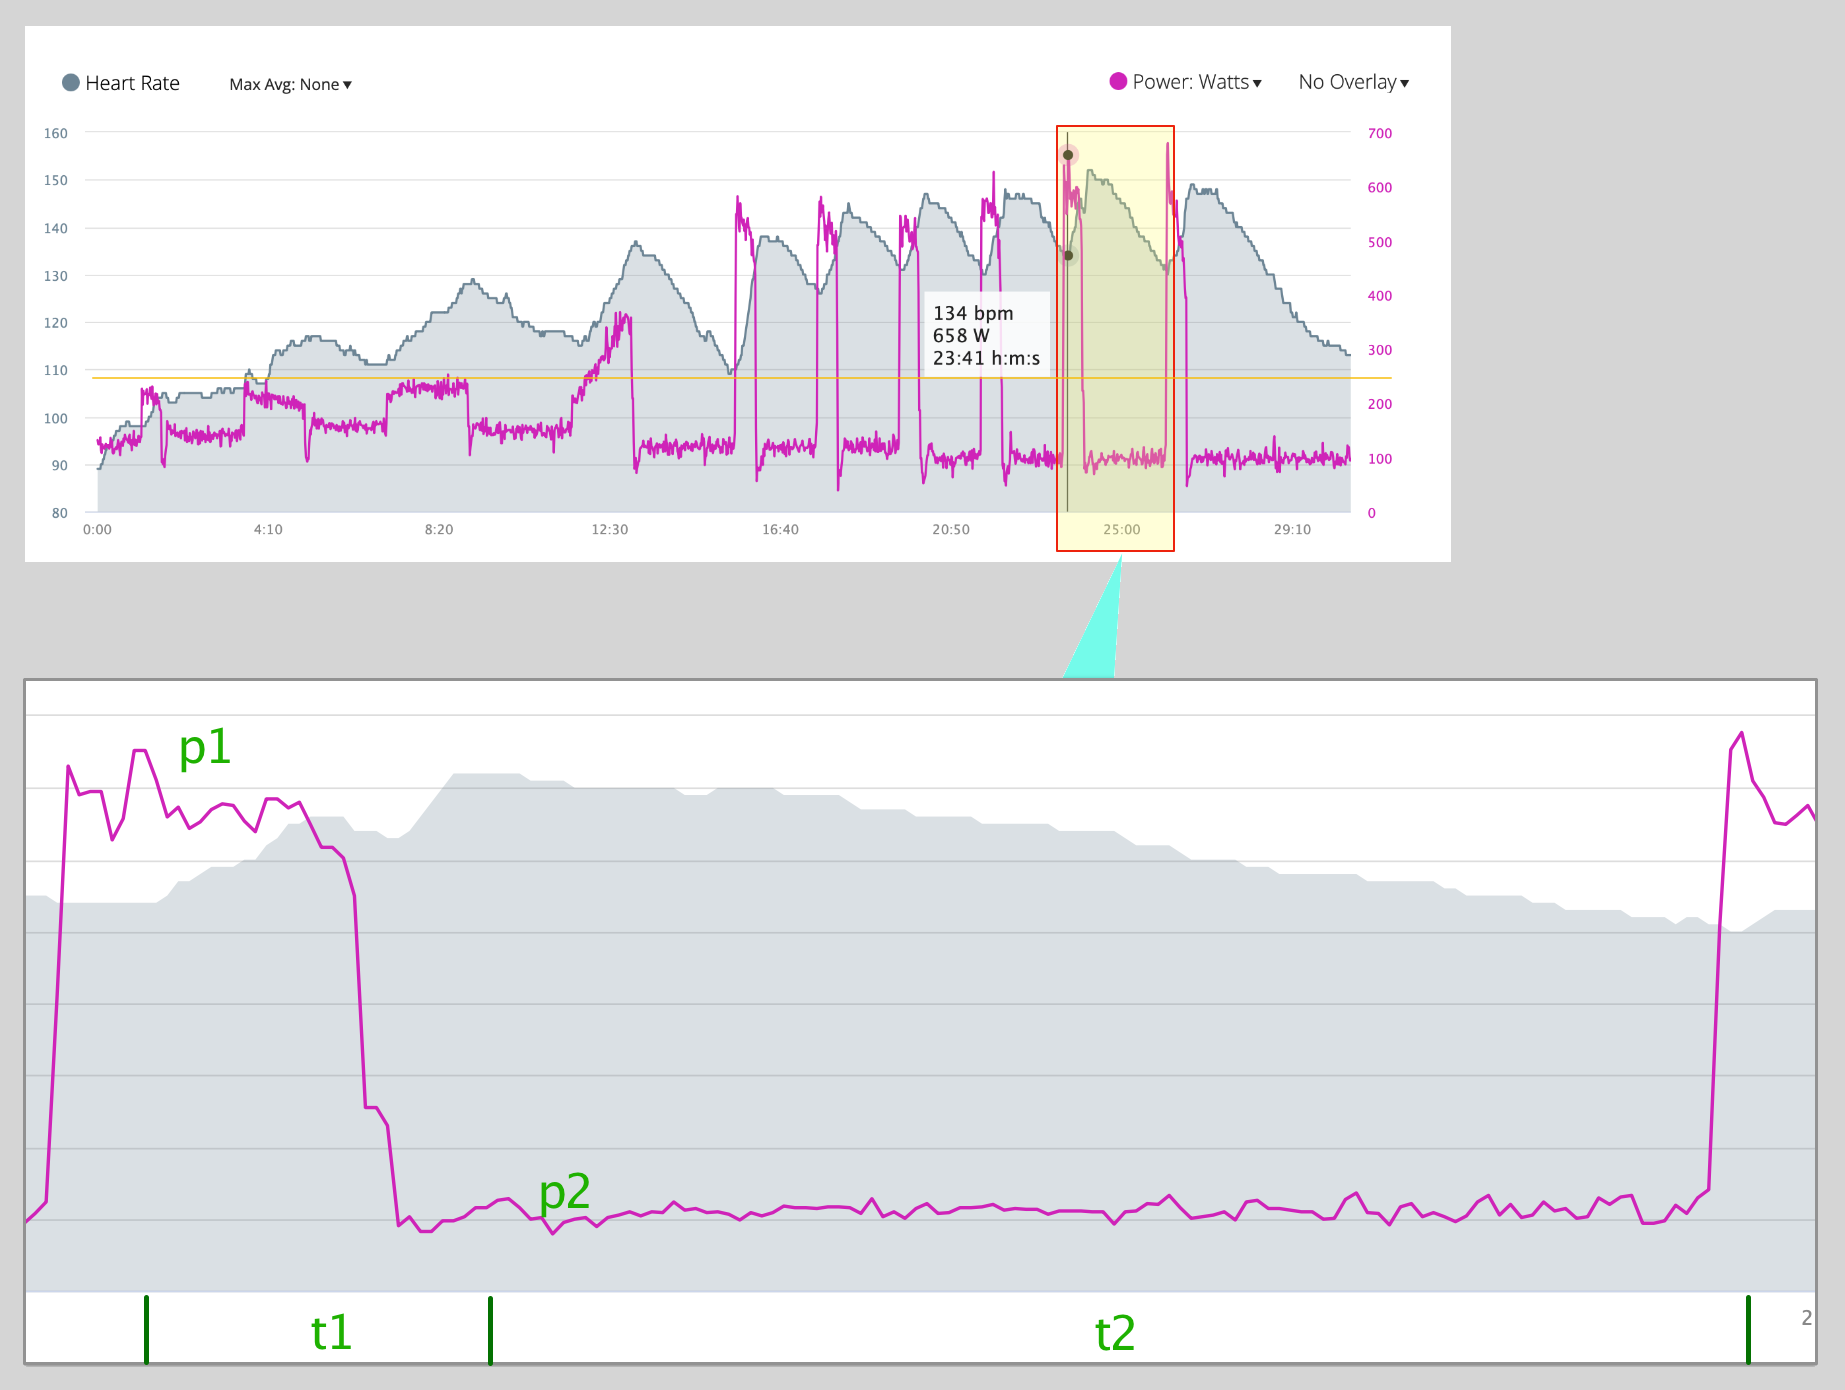
When I had FTP set correctly in TrainerDay, I liked looking at your zone summaries. Fun to look at but I could not make any decisions based these summaries. Here is the most important chart that I look at before each workout as I decide how to change parameters:
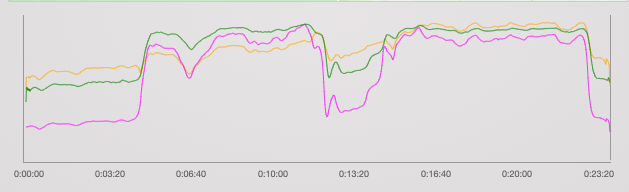
HR versus Power

Measure length of T1 (time from minimum to max HR) and T2 (recovery time) to set P1 (max interval slope power) and P2 (erg recovery power). FTP has no value outside of being a guide for an initial starting point.

Figure out the correct relationships between T1, T2, P1 and Interval lengths to get the optimal workout for any given day. Increase the values according to your overall plan and you can use this workout continuously.

I am actually in complete agreement with you on all points (i.e. FTP is too blunt. #2 is valuable to you) The problem is less than 1% of our users are building or using workouts with > 200% of FTP and the other platforms that focus on ERG workouts like TrainerRoad do it the same way so we are following the standard and standards are valuable. Just like FTP is valuable even if it is too blunt. If you are talking about analysis sites then they don’t include the original underlying target in their analysis or not that I have seen.

Here is Zwift

So distorting the scale for <1% of user base does not make sense at this time to me. I have seen some small companies do it like you suggest but their products look terrible and have virtually 0 user base and my personal opinion is this odd looking workouts is part of the reason.

We will leave this as a feature request and if it seems to be a popular request we can think about if there is some way to solve it such as following the Strava route on the history analysis page. I know manually syncing to garmin is a pain that’s why I would suggest looking at it in strava or free version of TrainingPeaks or IntervalsICU as those platforms are all ment for analytics and they will sync automatically so you don’t have to so this makes workout review painless.

I will keep thinking on this but I at the end of the day I have to think about what I think is best for us and best for most of our users.

Additional thoughts.

You say no one has complained about this clipping. Here are some reasons why:

  1. It is hard to see clipping:

These intervals are 700w. You can’t see where the clipping starts, so why would you complain? I only noticed this after a month of riding slope workouts.

  1. Slope mode is new. No one would or should create intervals like this in erg mode. I noticed that all of your most popular high intensity workouts still use erg mode for short intervals. That’s not good.

  2. What percentage of people use slope mode? Of the slope workouts I found, few people know how set the graphs to approximate the power needed. Workouts have flat graphs with watts at zero. This will not have display issues but it also doesn’t show what is going to happen during the workout - which is all I am asking for.

In the end, I don’t really care. I will set a high FTP to get slope workouts with intervals that work for a 62 year old and leave the easy workouts to the younger riders. Hopefully some will learn that high watt slope intervals are worth the effort - in more ways than one. Take care Alex.

I appreciate your passion for this Jim. But if you go to the first 250 workouts in our search you can’t find a single workout with more than 215%, you could probably look at first 1,000. I could run a database query but generally almost everyone here is using our app in ERG mode or even if they have a dumb trainer they are following more customary indoor training.

I have been recoverying from a small illness but wanting badly to create an automatic-slope mode high intensity interval video and promoting this feature. If this feature gets popular their might be more people needing > 215%, but as you can imagine it sucks in ERG to do super short sprints. I am still not clear if your problem is

  1. In the app while training
  2. In your library in the app or on the site
  3. In your history view for analyisis
  4. All 3

If #3 is your biggest problem then this is more solveble. If it is all 3 then this is a bigger problem.