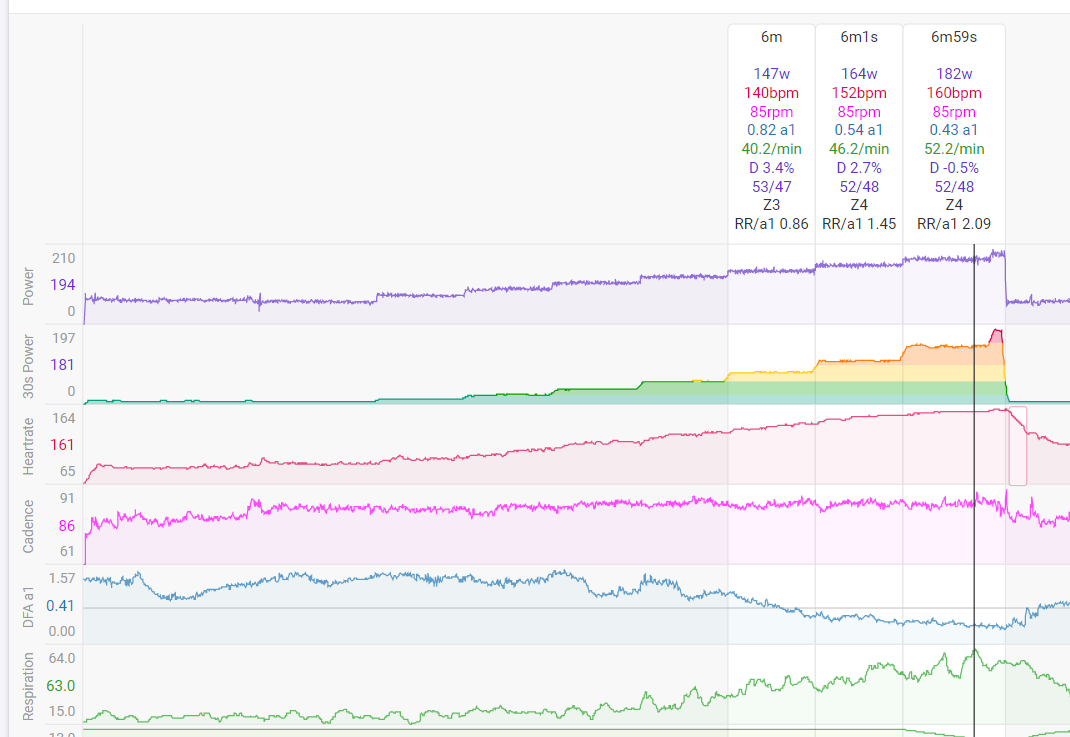
The respiration trace is calculated by the AlphaHRV IQ field on a Garmin, which has been shown to be more accurate then the resp values from Garmin itself.
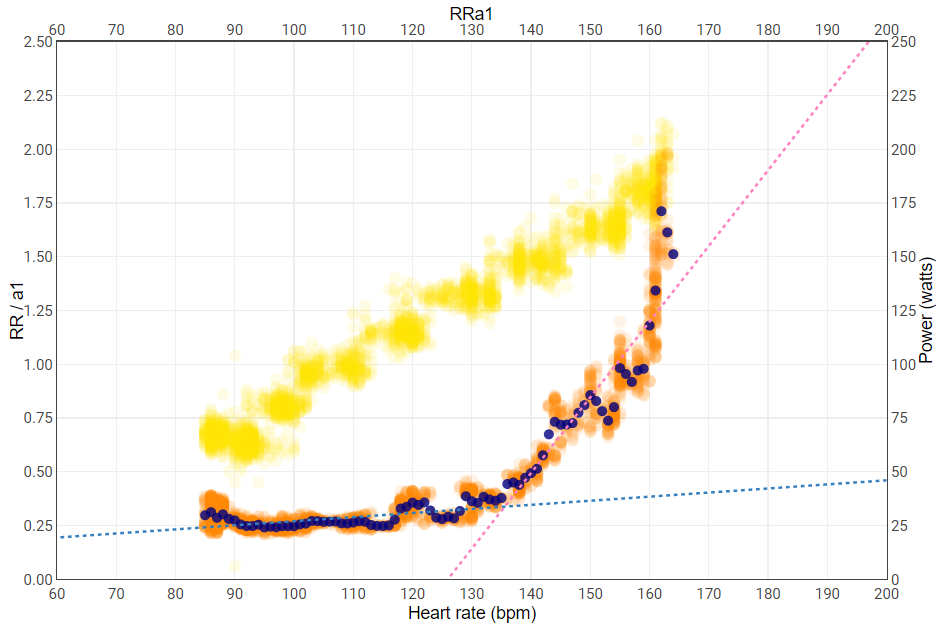
If you plot breathing rate vs Power, it should be very similar to a plot of breathing vs HR (in the aerobic zone power and HR evolve in a linear fashion). Here’s a plot of breathing/a1 ratio plotted against HR. The plot is available in Intervals and was constructed by Inigo, the dev of the AlphaHRV IQ field.
This would judge my AeT around a HR of 135 and a Power around 140W. Values that are entirely feasble compared to my experience.
LT2 is not really clear because I did not go all the way but it’s around 160-162 bpm.
I will have something ready to calculate breathing rate from the ecg signal recorded by Fitness ECG (from the Polar H10) in the next couple of days. This is a calculation based on amplitude modulation of the R-peaks and an entirely different method then the above calculation based on RR intervals. I’m very curious to see how well these methods agree.
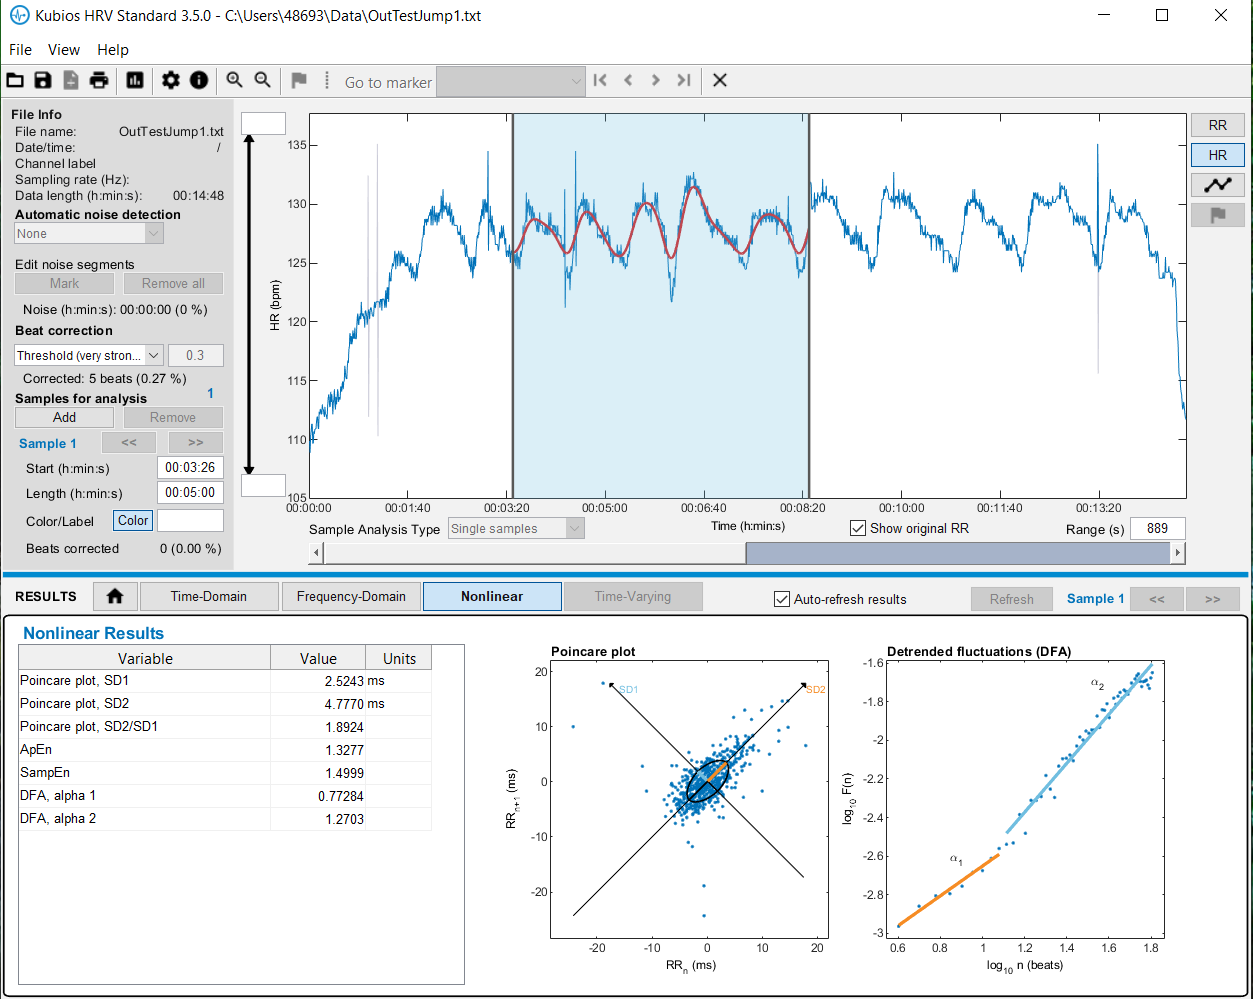
In mean time I tried to make sens from noisy data from Polar H10. As a ‘major’ test I used 15 minutes rebouncer session (if I can do the ‘hard’, perhaps I can also do the ‘easy’), with jumping intensity acceleration and slowing (kind of 4 seconds effort, keeping BMP below 130). Artifacts rate is near 10%, so Automatic Kubios correction in NeuroKit2 fails.
On Kubios PC software, I can use ‘very strong’ correction by hand, but results will suffer. So I used, with some pain, another correction method, called ‘neurokit’ and finally got < 0.5% of artifacts on that jumping data. I was also fouled by a subtle bug in NeuroKit2 and will report it to developers, as being subtle means, in that case, nasty.
Here are screen shot from Kubios software, with original data, artifacts corrected by manual Kubios method:
Five artifacts remain and I devise a step of final cleanup. Of course, objective is minimise the impact on fractal part of the analysis and I would need some additional files in order to validate that approach. I would like to ask Bruce…
R peaks are discovered and most of the HRV values become as in non distorted ECG. Author is hinting about up sampling the signal rate (original was 360), by even multiplier (like 2, 4…).
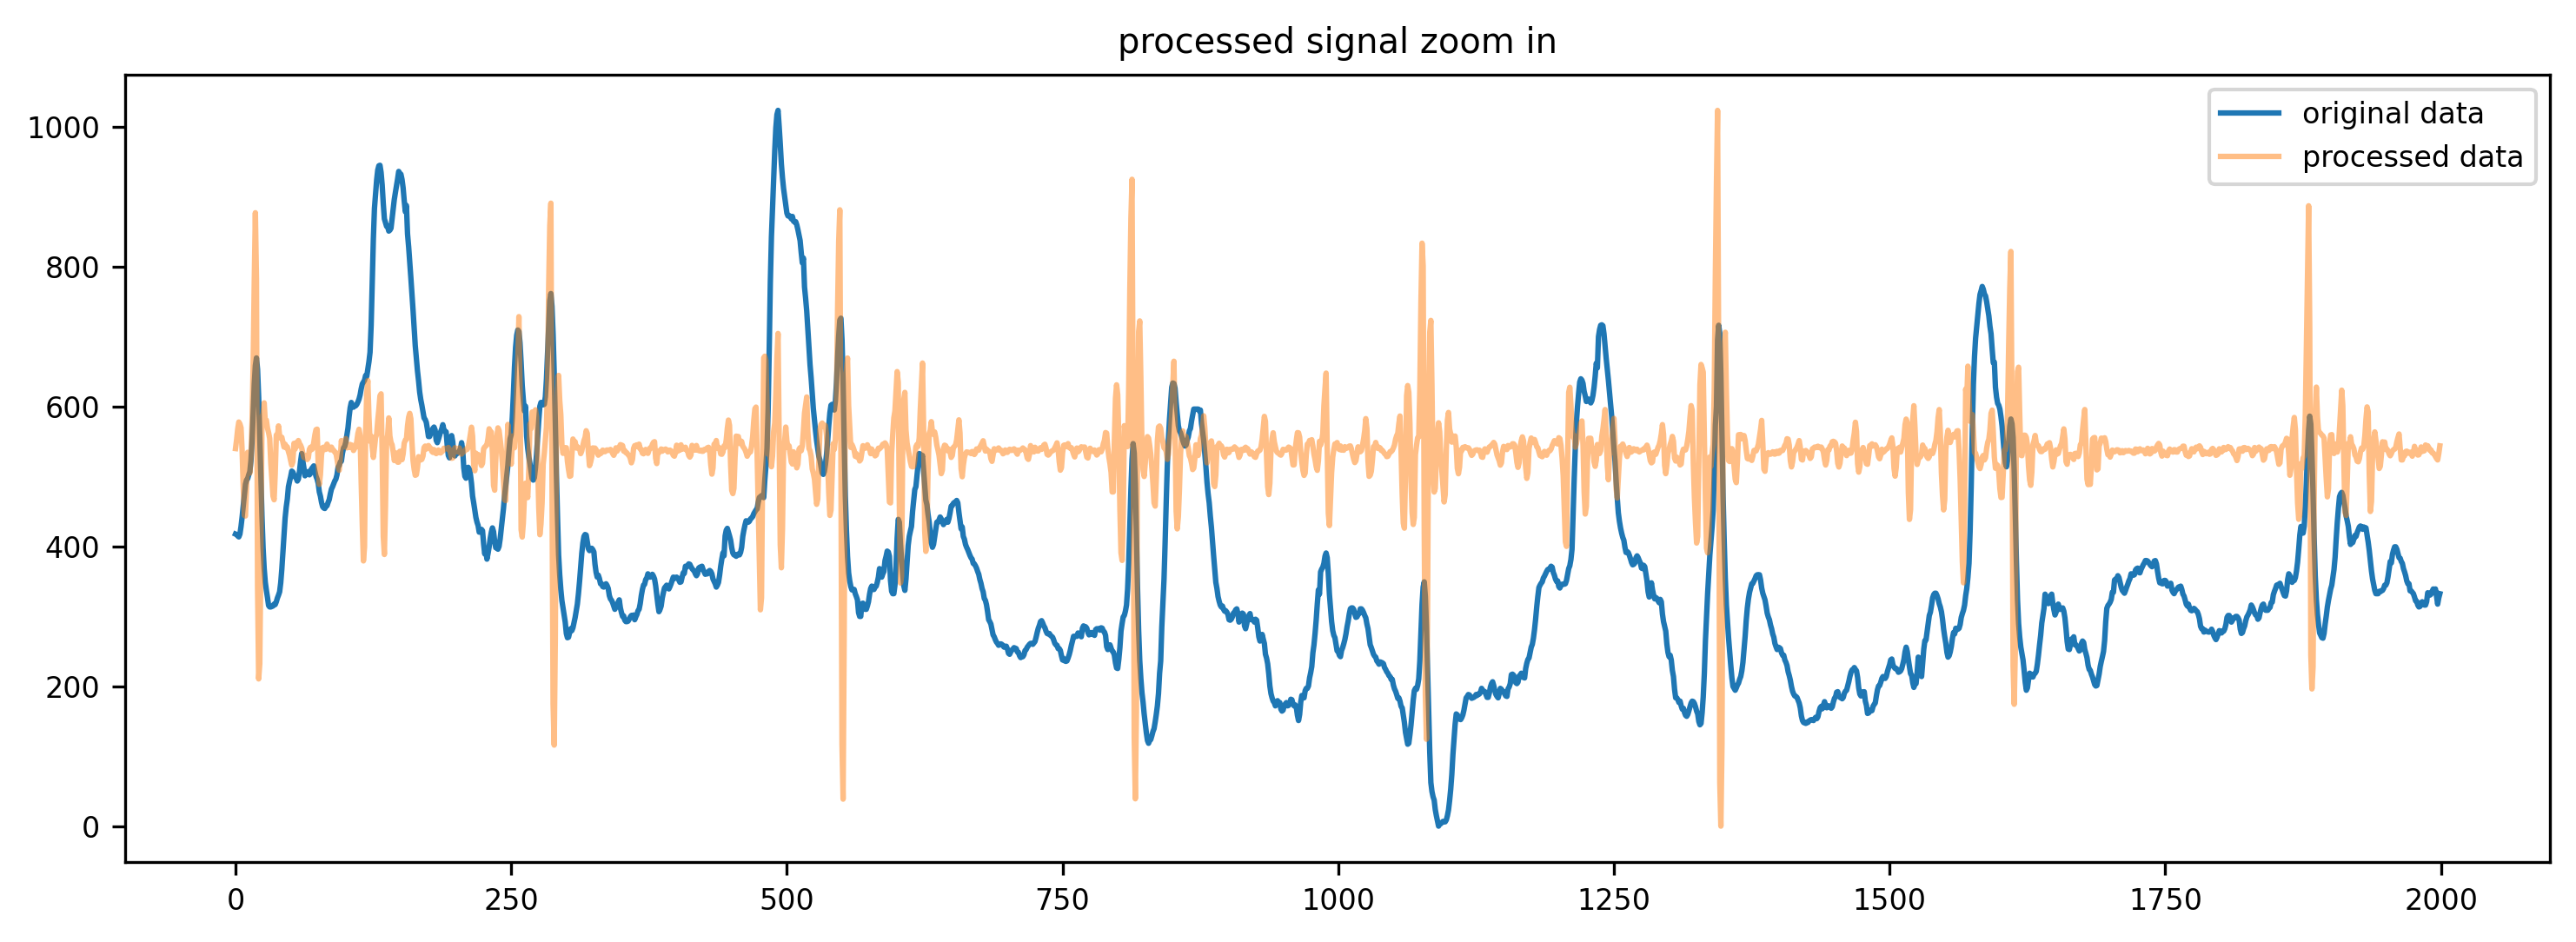
I’ve been playing with the Polar H10 ECG signal lately and it is amazing to see what a very simple bandpass filter can do…
I know the sample rate of the H10 isn’t high enough to provide accurate RR intervals for calculating HRV parameters, but applying a bandpass filter, resulted for me in a total of 3 RR artifacts during a 80min recording. 2 of them were missing beats and one was an APB (early beat). The artifacts were identified easily by plotting an RR stream. Inspecting the ECG at the sampling index of those artifacts, showed that the 2 missing beats were clearly movement artefacts and the misplaced beat was effectively an early beat without P-wave. Those are mostly harmless if frequency is low.
I checked the ECG signal without filter and there were 3 ranges with significant ‘distorsion’. Those ranges looked really a lot better by just applying a bandpass filter.
I am using a second order derivative from the filtered ECG as beat detection algorithm.
I just have one more problem to solve regarding timing to make a remarkable comparison between HRV derived breathing rate from AlphaHRV and R-peak amplitude modulation derived by my own method. The closer I get to a final detailed comparison, the more I’m impressed with the AlphaHRV results.
I noticed some interesting stuff regarding Tidal Volume estimation from the same stream but first have to read up on that before getting to far in my assumptions…
My knowledge at this point assumes that, within the aerobic range, Tidal Volume grows linearly just like HR with a linear Power ramp. That ‘feels’ logical because the O2 demand grows at the same rate as the Power (work). Once above AT, Tidal Volume grows exponentially because the O2 demand is exploding and can’t be satisfied anymore by the ability of the lungs to extract the needed O2 from the inspired air. The only way to get more O2, is by processing more air. At least that’s how I see it now. But I have to do some reading.
When I calculate an estimation of breathing volume from the same signal, I see a very moderate almost linear growth of volume, while the breathing rate increases faster and has a clear deflection point where the linear trend becomes exponential. When I plot Tidal volume, as the product of the rate and the volume, the signal remains linear until far beyond the rate deflection point. First impressions are that Tidal Volume might have a deflection at AT (LT2). But this is all very preliminary. I will share what I find out from my own data, but that is off course a n=1 test.
Very interested. I need to read previous comments above soon. I guess this is obvious to you, or you likely know this better than I do, but I read that stroke volume stops increasing around AeT and it switches purely to faster heart rate at that point. Since stroke volume has room for improvement and BPM does not, you push your heart in a way to increase stroke volume at AeT that is why it is so effective… Anyway. I have no idea where I read this or if it is true. But I wonder if that has any bearing on breathing. Probably not.
Amazing report of ECG recording quality. I know that you use now Polar H10 with Garmin strap and it made huge difference. From my frustration about signal quality, yesterday I moved my H10 fare away from suggested standard position and artifacts rate on 34 minutes cycling, 120-130 BMP went down to 1.5 % (from near 10% before). When cutting ‘transitions’ (two missing beats when installing the gear and moving to rebouncer), I’ve got 2 missing beats. Cycling session was near ideal. I did not check ECG yet (and NeuroKit2 method of making sense from it), but this is a big step (at least for me).
Before commenting on Claude musing about HR, O2 and other details, I pulled from my shelf “La Course a pied” de Newsholm, Leech and Duester in French, published in Bruxelles in 1997, but the original is from 1994: “Keep on running: the science of training…”. I should admit that sport physiology, biomechanics, parts of biochemia, anatomy etc i HAVE to study 55 year ago, so it will be another refresh, which seems necessary. I cannot get everything from memory old bases are just good for building up better knowledge quicker.
I’m also willing to change my mind in 3 minutes, if I see right arguments: we have too many assumptions ready to give advice (economy of energy) and there is so much noise we cannot correctly estimate.
If I remember, long effort limitation is not the lungs, but heart and blood. I stop there and will now add a comment on ‘4 seconds effort study’, as I found reference to ‘10 seconds effort + 20 seconds rest’ in mentioned book, as a method of aerobic training.
Yes, @Alex, stroke volume stops increasing, but AeT may be rather linked to blood quality (hemoglobin proportion) and low viscosity. If you stroke volume gets bigger, your heart will slow down: moreover your heart will also need additional resources, proportional to its volume. There is a trade-off somewhere, I guess.
I did a 20 minutes Polar H10 ‘stress test’ on rebouncer with 10 high jumps every 20 - 40 seconds, putting strap in new, strange position mentioned for my cycling tests. Artifacts went down to 3 % (from about 10%), Fitness_Dashboard and DFA a1 was still very useful most of the time.
I do not need it further on rebouncer, as I can used armband HR only for keeping the BMP in range, but it was a proof of concept in relation to artifacts generation and H10 position. For the moment I do not need to replace the strap with Garmin one. Happy enough!
The H10 calculates RR and HR internally and sends that info over 1 channel (BLE and/or ANT+).
On a second BLE channel it sends also ECG amplitude information sampled at 130Hz.
The ECG channel at 130Hz has a limited precision to calculate RR from, 1000/130~7.7ms accuracy. That’s not good enough for correct RR - HRV purposes.
The RR-HR channel sends RR intervals measured at a much higher frequency ( in the order of 1000 or 1024Hz) and the accuracy of those is ~+/- 1 ms. That is needed for HRV. But that channel has no amplitude information and can not be used for ECG trace.
At the higher sample rate, the ECG information would result in a way too high data size to send over BLE.
So if you want the ECG trace to check the signal quality and amplitude, and you want correct RR information for HRV calculation, you need to use both channels.
That’s what the Fitness ECG and Fitness dashboard do. ECG connects to one BLE channel. Dashboard connects to the ‘normal’ HR-RR channel over ANT+. Head units and other apps simply connect the normal channel over ANT+ or BLE as you want.
Polar H10 RR sampling rate is definitely 1000 kHz When on Github’ I checked Polar H10 SDK (looking for Accelerometer data format), I’ve seen: “RR Interval in ms and 1/1024 format”. Now, awaiting answer from SDK provider.
Yesterday H10 connected to TrainerDay on Android tablet. TD connected also to Elite TUO Power sensor and Magene Cadence meter. H10 connected as well to Polar Datalogger on Android phone (for HR, RR and ECG, it will provide three CSV files). Those connections need BLE with normal pair up. Fitness_Dash connects to available devices with ANT+, so connection to H10 was reporting without asking to pair up.
The Elite TUO sensors will also provide ANT+ data for power and cadence (so Fitness_Dash will gather it), even if BLE of Elite is used by TrainerDay application.
Now, from technical point of view, ECG data can be handled much more efficiently with quite simple optimization. It is also probable that ECG transmission overhead was solved already by Polar and / or others, but I would need to look into Polar SDK for ECG raw data format. ANT protocol even as ‘Advanced Burst’ (60 kbit/s) may be not enough for compressed ECG data, hence the necessity to use BLE for ECG.
Would you mind checking the RR stream from Polar Datalogger to see if it actually uses the sensor RR-stream?
I suspect Datalogger is making its own calculations for RR and HR based on the lower resolution ECG signal and is not using the sensor’s higher resolution data.
If all RR intervals are separated by a multiple of ~7.7ms (1/130 of a second), that would confirm what I suspect. The higher resolution stream from the sensor has RR’s as low as 2 msec.
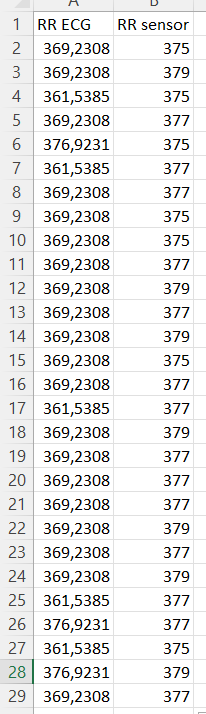
PS: data is not exactly lined up for the 2 different streams in this screenshot! First column is what I get when detecting from ECG, second is the RR stream recorded by the Garmin in the FIT file.
This would mean that Datalogger only connects the ECG channel when selecting ECG.
It might connect to the sensor stream if you don’t select the ECG. Don’t know because I never used it. But from data I have seen here and on intervals forum, I became suspicious…
I don’t mind trying to help a bit in the progress of science I believe you understand programming a little. Do you understand javascript or how to do this at all? Here is a small article showing how to read HR data in 10 lines of code.
I could create a super quick video showing how to get this working if it is not obvious. Then we just need to expland on that and add RR and maybe figure out how to add ECG data and then you could be off and on your own. I have some very old code for pulling RR data out of these data fields. I remember RR data can be slightly confusing but I am sure we can figure it out without too much work. If we get stuck I can ask my developer for help.
I figure since you are so motivated by this, understanding how to do it yourself can allow you to build what you want fairly easily with a little help from us or others. Let me know if you want that video as a next step.
Well Polar Dataloger provides RR intervals which are not having identical reminder after dividing by (1/130 * 1000, 7.692307692 in msec).
Second column is cumulated serie of RRI
RRI
> 1/130 * 1000 >
7.692307692
600
600
78
598
1198
155.74
77.74
595
1793
233.09
77.35
586
2379
309.27
76.18
585
2964
385.32
76.05
590
3554
462.02
76.7
587
4141
538.33
76.31
589
4730
614.9
76.57
587
5317
691.21
76.31
586
5903
767.39
76.18
583
6486
843.18
75.79
578
7064
918.32
75.14
586
7650
994.5
76.18
584
8234
1070.42
75.92
584
8818
1146.34
75.92
I think I excluded that possibility by comparing HRV parameters calculated from RR and ECG using NeuralNet2 in one of my previous posts (post 300 on New AlphaHRV version, I mean on Intervals blog).
Looking at your data it is, in my opinion, an obvious bias: all RRI values are ‘odd’ only.
But thanks for checking the Datalogger stream. If any RR difference is below 7, it can only mean that the datalogger is effectively using the sensor’s RR stream.
The degree of fragmentation of cardiac interbeat interval time series increased significantly as a function of age in the healthy population as well as in patients with CAD. Fragmentation was higher for the patients with CAD than the healthy subjects. Heart rate fragmentation metrics outperformed traditional short-term HRV indices, as well as two widely used nonlinear measures, sample entropy and detrended fluctuation analysis short-term exponent, in distinguishing healthy subjects and patients with CAD.
I’ve read it already twice and checked my own HRF to check possible signs of CAD (before going to my triathlon event). But this is just one side of the story. Another one is that standard HRV parameters could give false impression of security (while checking rMSSD in the morning), as with age, ‘good’ readings mostly means CAD problem.
There is also important information about RESPIRATORY SINUS ARRHYTHMIA AND ANOMALOUS SINUS RHYTHM (and how it can be spotted with RR, so @MedTechCD can be interested).
My (controversial) conclusion is, that HRV promises are possibly good for guys below 40 years old.
I need to check how that HRF behaves under load as it looks like independent enough from HRV to bring better judgment of exercise impact on heart work.

 or if it is true. But I wonder if that has any bearing on breathing. Probably not.
 Now, awaiting answer from SDK provider.