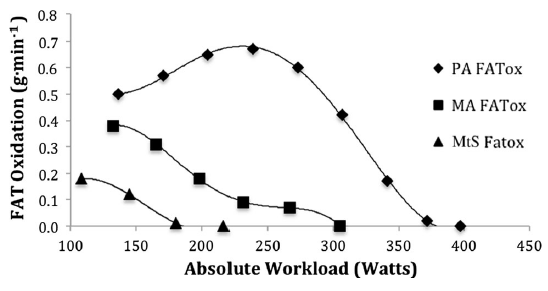
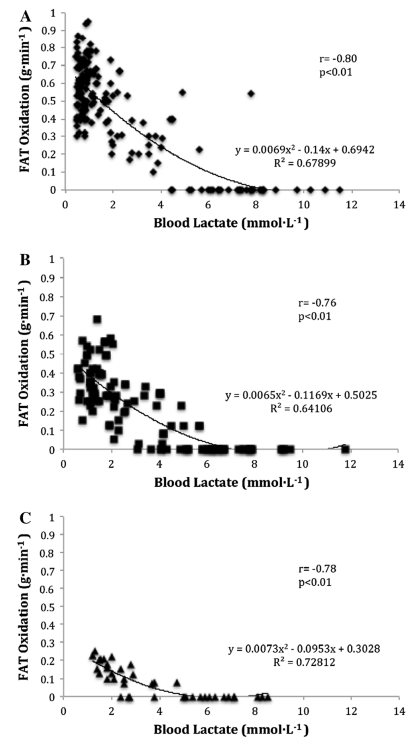
The correlations between FATox and [La-] for all groups were strong (PAs: r = -0.80, p \ 0.01; MAs: r = -0.76, p \ 0.01; MtS: r = -0.78, p \ 0.01) (Fig. 4). The relationships were all nonlinear, yielding similar quadratic coefficients (&0.007) and linear coefficients (&0.1); however, the constants ranged from &0.7 in PAs to &0.2 in patients with MtS. The correlation between FATox and [La-] for all data points for all groups together was also significant (r = -0.76, p \ 0.01).
Yes, it looks that way. At / just below, but not above, VT1 / LT1 is a key training level in so many protocols.
Maybe the broad brush 85% FTP capped by 83% HRmax protocol - that Steve Neal describes for athletes that haven’t had a formal Fatmax test - isn’t far off really.
There is also some interesting stuff on that TR thread referring to how much carbohydrate is required to facilitate Fatmax. ISM is repeatedly quoted as saying proper carbohydrate fuelling is important when training at this level.
It isn’t clear (to me) if he would say that for a 1 hour workout, rather than the multi hour rides he looks at?
There is also mention of very well aerobically trained cyclists (Wout Van Aert is the example) doing fatmax intervals as part of a longer ride.
The point being that, like MAF HR power in very well trained cyclists, the workload is pretty significant and isn’t repeatedly sustainable for the durations those athletes need to train for.
I think that translates to less well trained athletes too.
Take the 85%FTP with the 83%HR cap workouts. Less well aerobically trained athletes can’t repeatedly (i.e. day after day) work at that level for extended periods of time.
It is trainable and, based on my own experience with them, I encourage people to consider such workouts - at the right time - as part of their aerobic development work. But they do need to be worked up to, not jumped into “off the couch.”
It likely is true that Fatmax can be accurately measured by their system, at the moment the test is performed.
How regularly would someone need to be tested to make sure their number was accurate?
How much more effective would the training based on that number be, than just training at / just below VT1 / LT1, or than just training at 85% FTP but observing a strict 83% HRmax cap?
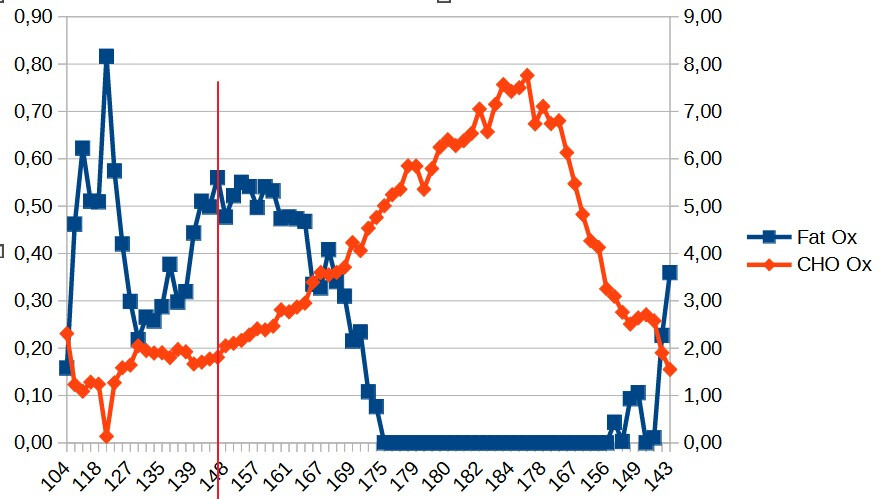
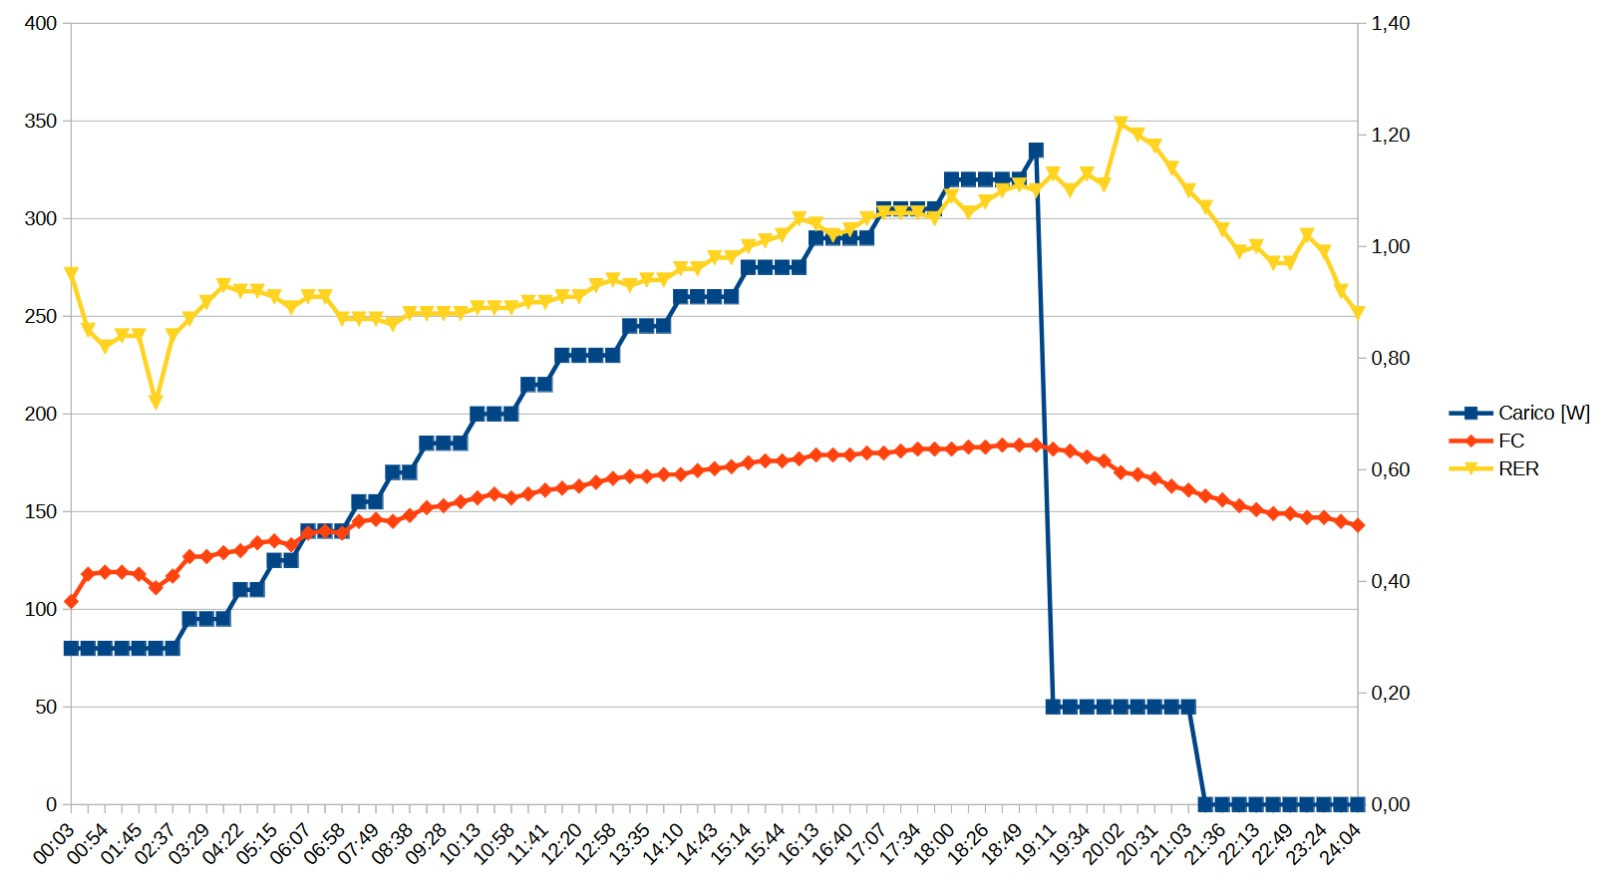
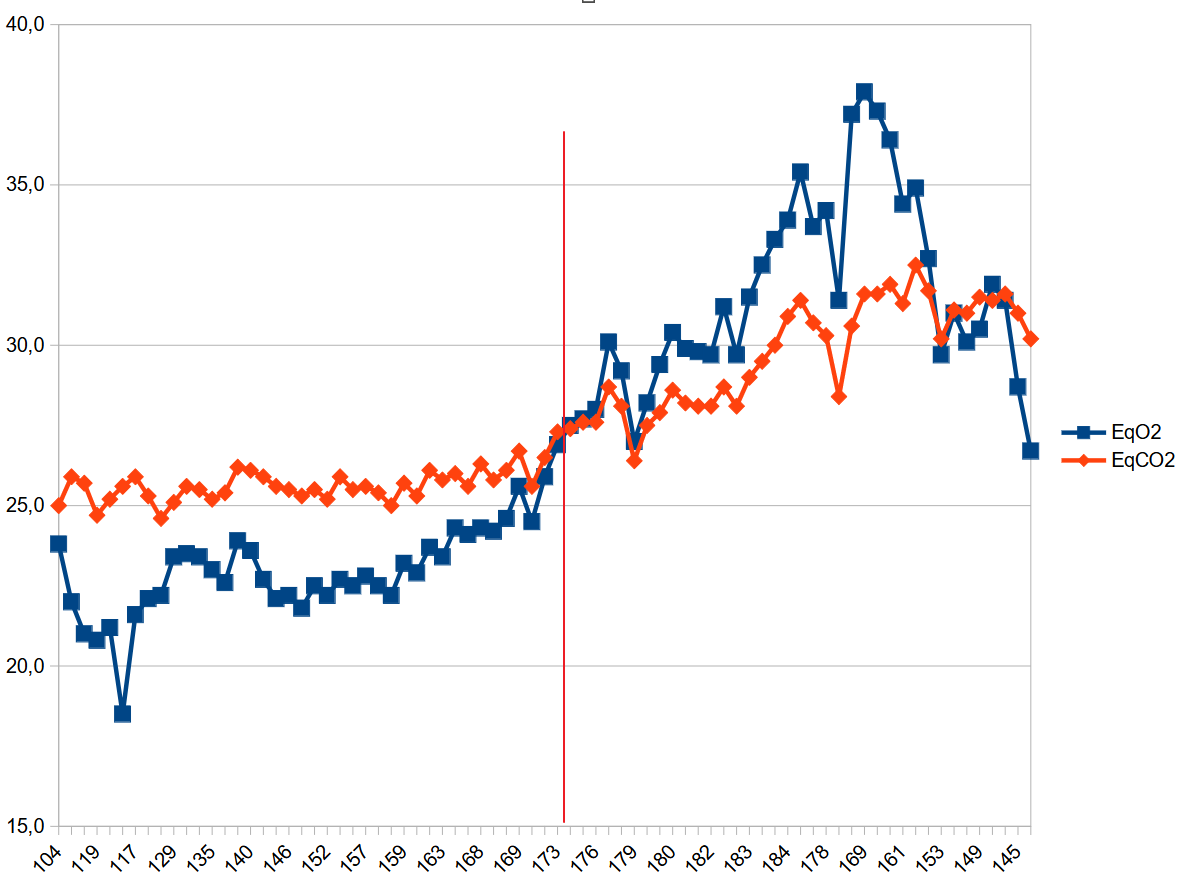
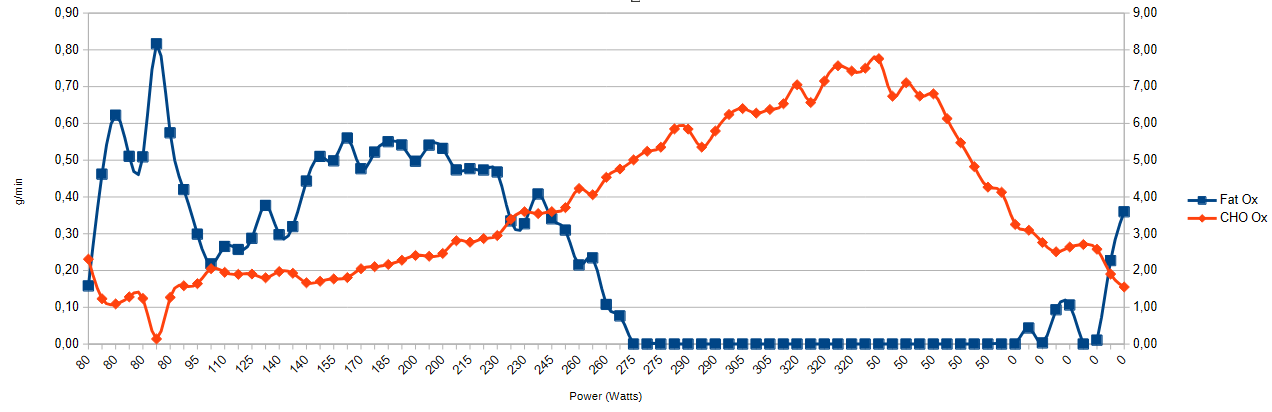
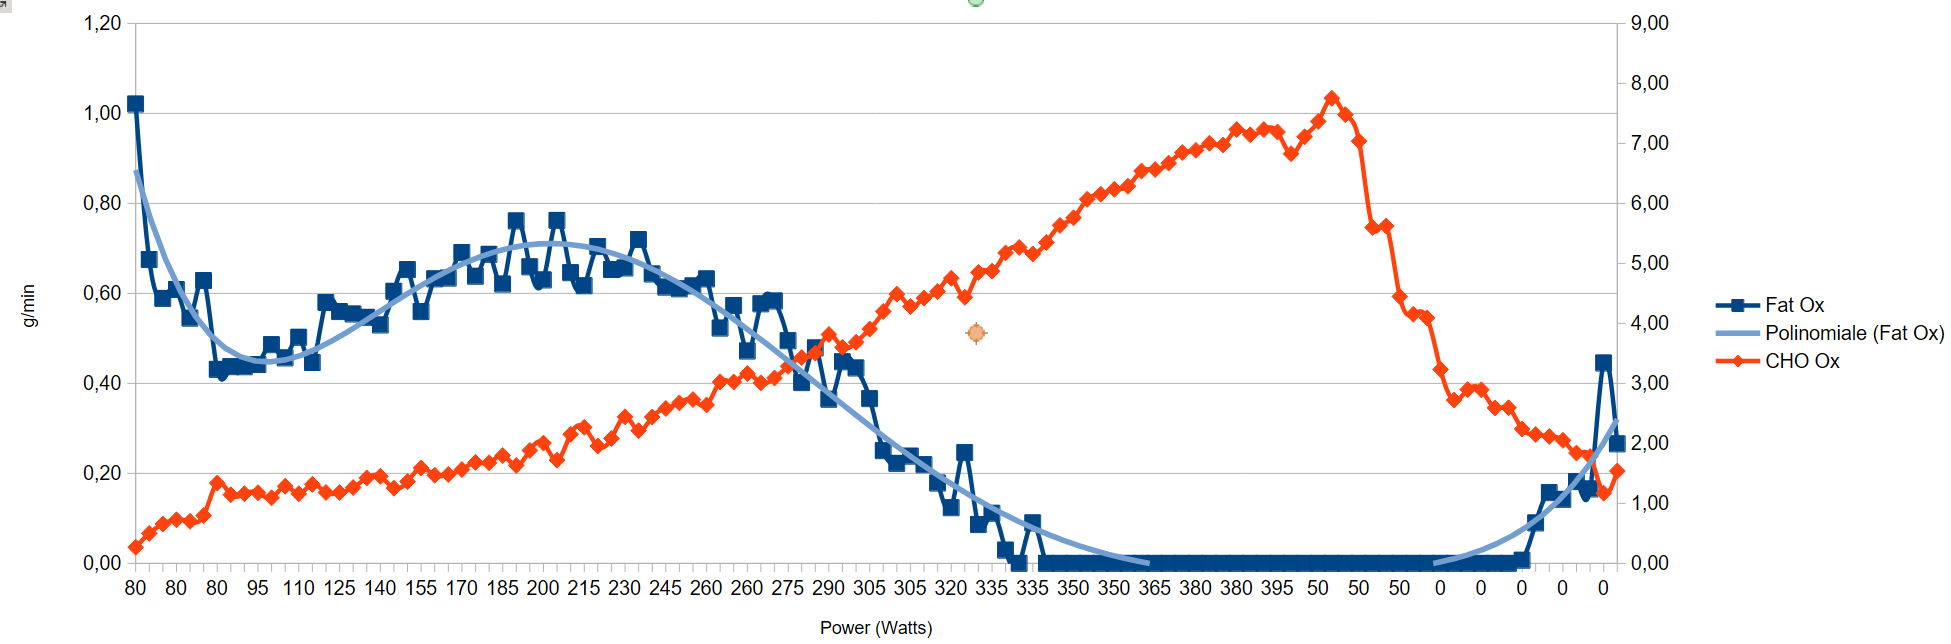
I just managed to get the tabular data of my last Cardiopulmonary Exercise Test (CPET) from the laboratory and I was able to create the charts of my fat and carbs usage (HR bpm on X axis):
Nice to see the confirmation that the FATMax zone is basically my VT1/LT1 threshold (around 146 bpm). From the last chart I can see that my anaerobic threshold is at 174 bpm - I’ll investigate why the doctor set it at 171 bpm.
I’ll perform a new test in March - I’ve to first recover my anaerobic form after the last 2-3 months of base training
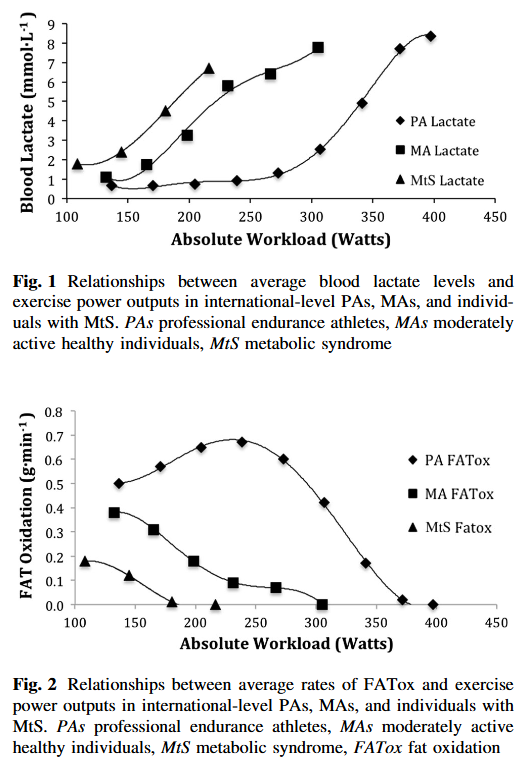
San Millan / Brooks did their graphs a little differently, but you can tell that your curve is more like the pros curve than the moderately active healthy individuals.
I was asking about the CPET test at the lab. I thought you had done more than one - my mistake. But it will be interesting to see if there is much difference in March.
The anaerobic side should come back quickly. In case you missed it on another post, you might find the video in this post interesting
None of the metabolic syndrome participants even reach 0.3 g/min fat ox.
Some of the recreational cyclists have good fat ox and some do not. It looks like ~ 20% of the participants at 2 mM have > 0.5g/min fat ox.
It looks like ~ 70% of the pros at 2 mM have > 0.5g/min fat ox. Some of the pros have fat oxidation at 1.X mM only have 0.3 or 0.4 g/min fat ox! I wonder if these cyclists are sprinters.
Genetics and training each must play a role here. Pros > amateur > metabolic syndrome, but of course that is obvious.
What causes the variation within each group? We can’t change our genetics, but we can train differently. Maybe that is where the high % of training time < 2 mM comes in.
in my opinion the answer is “training”. Expecially With Z2/FatMax/MAF training you do exacly that: you train your body to burn more fats to use as fuel.
I’m not sure to have misread your question, but FatOx rate can be highly impacted by training and is not only genetic dependant. During my next test I expect to see higher FatOx rate; before my last test I was mostly doing anaerobic (around LT2) training + fartlek (MTB). Let’s see
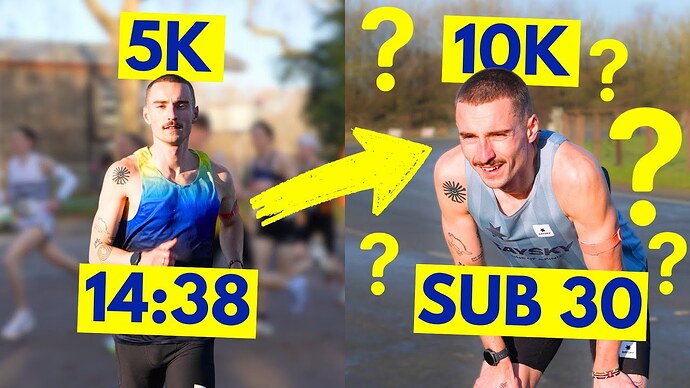
Another running video caught my eye today. It is about lactate test results.
“Ben is Running” is training towards a sub 2h20m marathon (12 April 2026), so is a very serious runner.
He does a chunk of his aerobic training on a Zwift Ride bike, which I find interesting.
He talks of a training session that is he completed on in Sep 2025 and then repeated in Jan 2026. On the treadmill: 12x 1km at 3m05/km.
He says that in the September 2025 session he hit 8mmol/L lactate, and in the January 2026 session he hit 2.2mmol/L.
For those of you that test lactate, am I right to be sceptical about the difference? Keep in mind he ran a 30m22 10km in September 2025, so he was in pretty good shape then.
Could someone at that level improve that much in 4 months?
The video is cued up to the relevant 90 second or so section that starts at 4m40
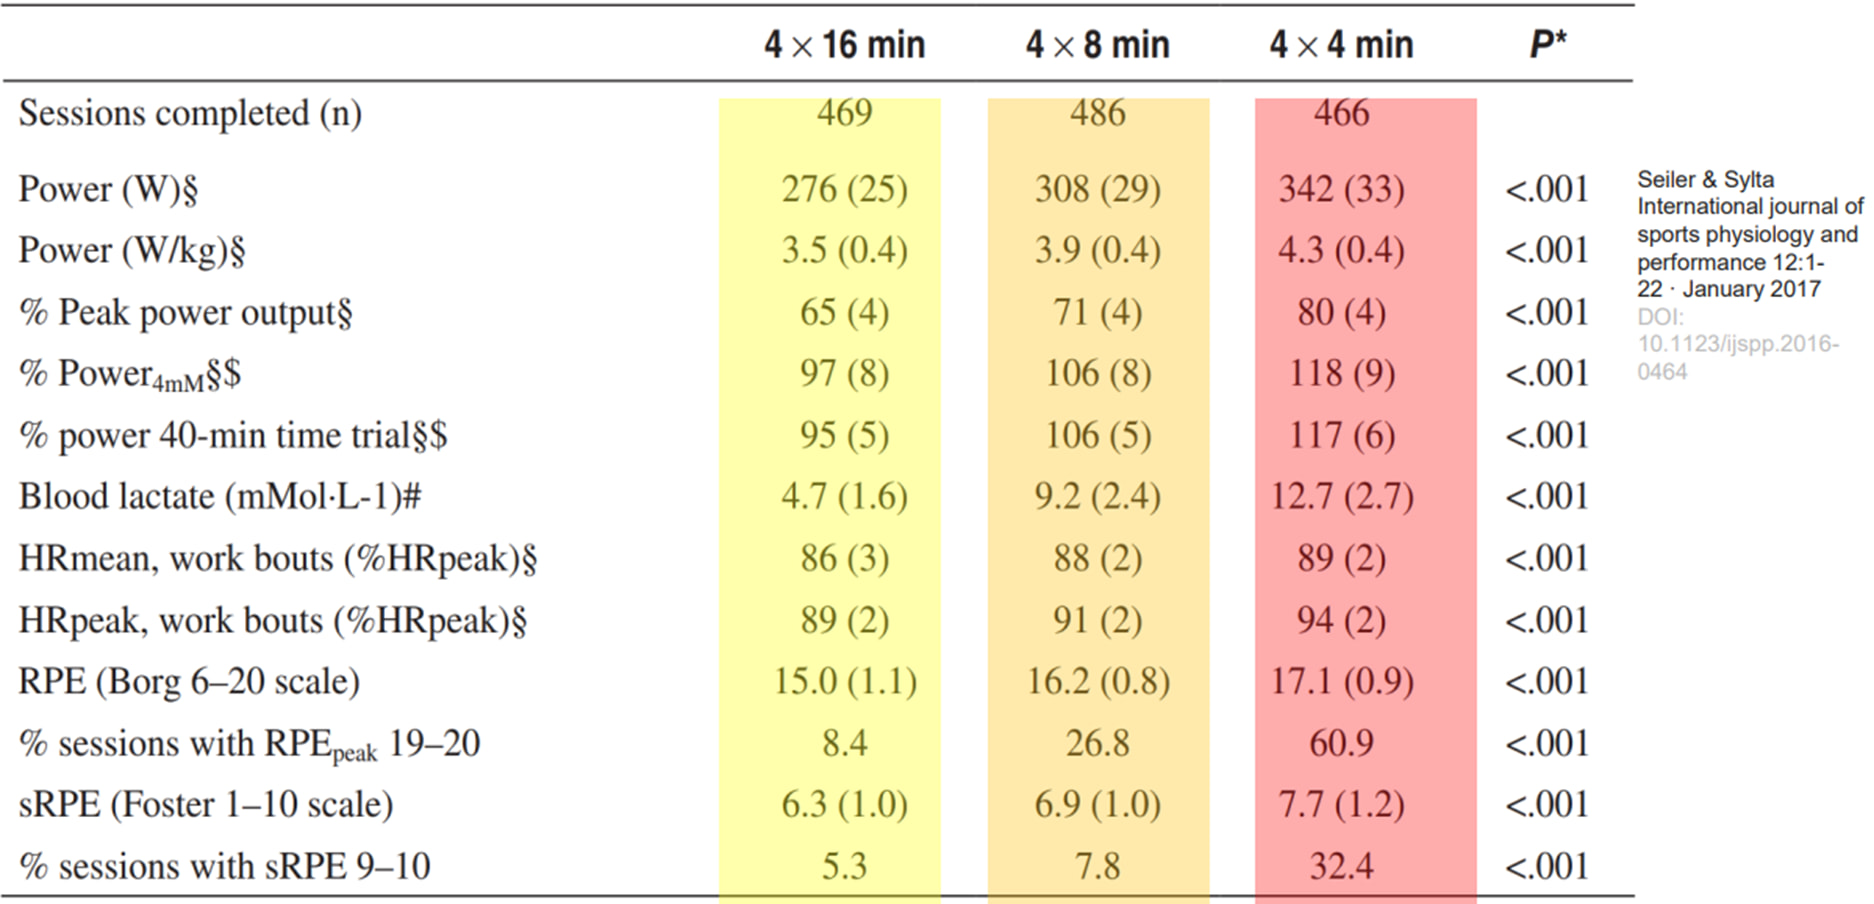
4 mM power roughly equals 40 minute time trial power which should be a good estimate of steady state. 9.2 mM lactate for that same population was from the 4x8s, a very hard workout.
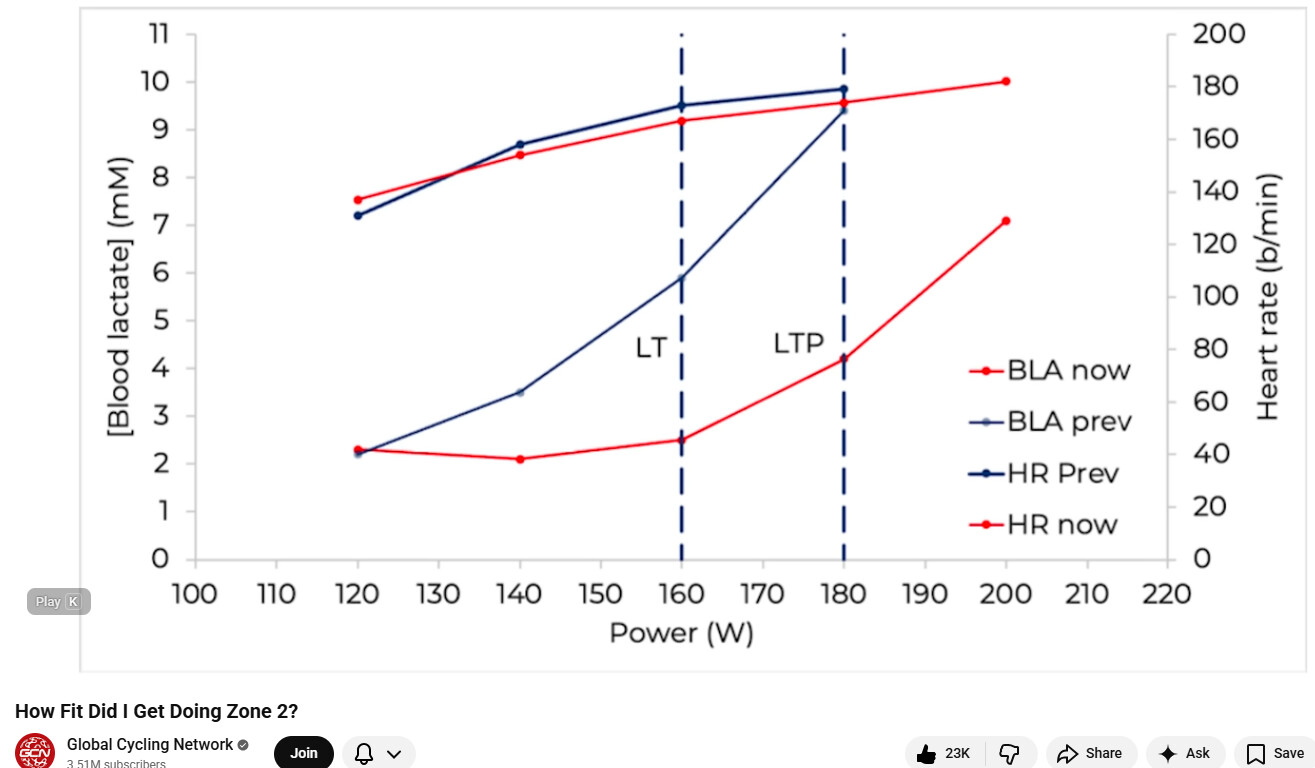
Here’s one more data point from Manon’s zone 2 videos on GCN from a year ago:
She had detrained to the point in the blue graph that there was no lactate control at all really. Lactate rapidly increases from 120W. After 6 weeks of training she now maintains 2 mM until 160W when it starts go to up. In short her fitness increased tremendously in those weeks, but again she went from a state of being completed detrained after years previously being a professional athlete and presumably is a hyper responder to training adaptations.
What I understand then:
Lactate levels are very individual. 4 mM may be population average for MLSS but there is substantial variation.
Lactate is difficult to measure, it can be contaminated and requires a dietary regimen is followed for a duration of time before the test.
People who went down the rabbit hole such as those on the TR forum in the huge lactate thread generally don’t seem like they’ve gotten a lot out of it.
So, the gentleman in the running video may just be someone who has really high lactate at threshold. Maybe his cycling equivalent 40 minute TT lactate would be 8 mM and not the 4 mM the average person would have?
The bit that caught my eye is that he says he hit 8mmol/L when he was fit enough to run a 30m22 10km and now, soon after only hitting 2.1mmol/L on the same workout, is wondering if he can do a sub 30m 10km.
I will watch his next video, when he has the result of that next 10km race. If he does 29m59, I will still be wondering about the magnitude of the lactate reduction. The faster he is, the less I will be wondering!
Regarding doing biking. He seems smart/observant enough to understand himself and limiters. If it is a central limiter and he know he has running injury risks this makes complete sense as a safe way to increase aerobic volume. This is less likely for cyclists and they don’t usually have the same injury risk.
I ran 1 hour 10k as about my best in late 40s… never ran before in my life and did a marathon… I am almost as fast as him
I don’t get 8 > 2, this makes no sense to me… but I don’t know much about lactate other than general youtube “gossip.”
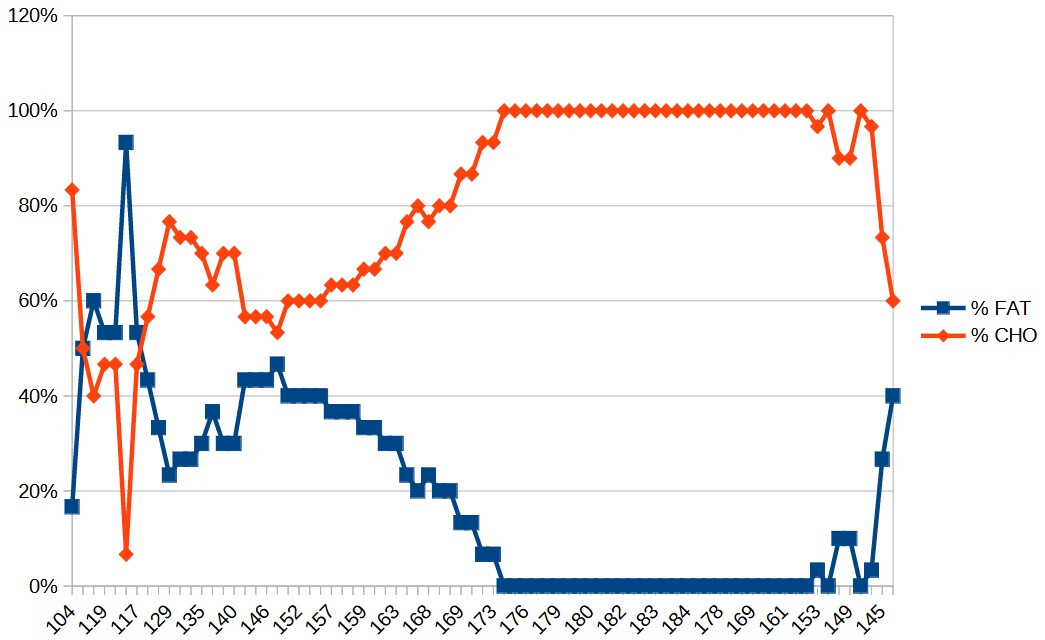
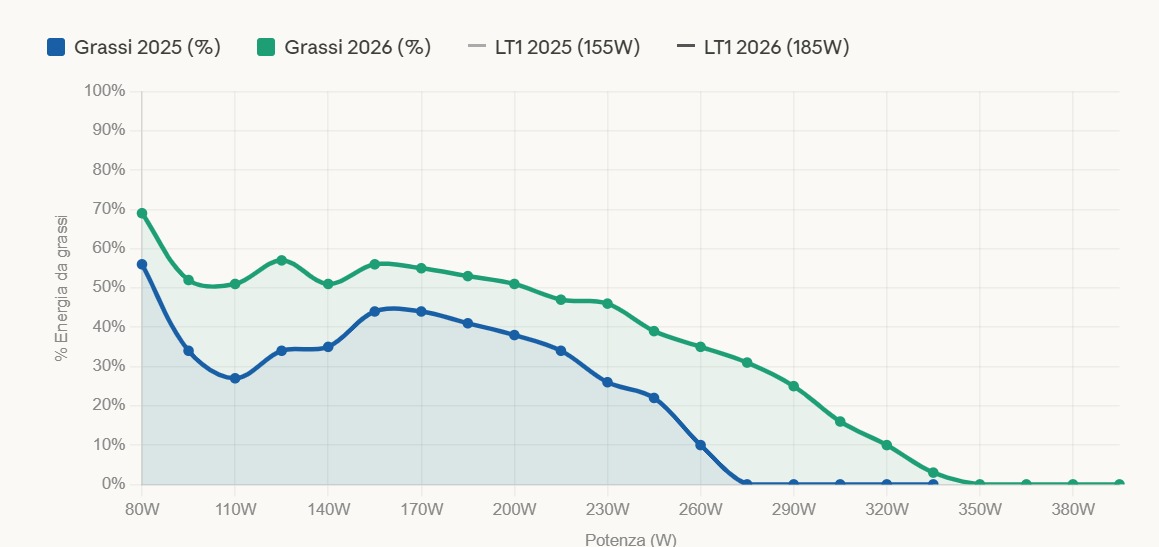
Blue is % fat usage in 2025, green % fat usage in 2026 (results from the two cpet tests)
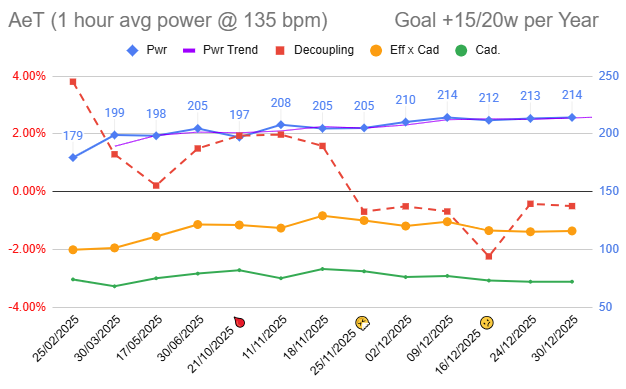
LT1/VT1 went from 155w to 215w (on the chart it’s wrong) and LT2/VT2 from 260w to 310w. Max power from 335w to 395w. FCMax from 184bpm to 183bpm (getting older…)
Absolute Fats usage (g/m) increased from 0,67g/min to 0,78g/min (looking at trendline from 0,65 to 0,75)
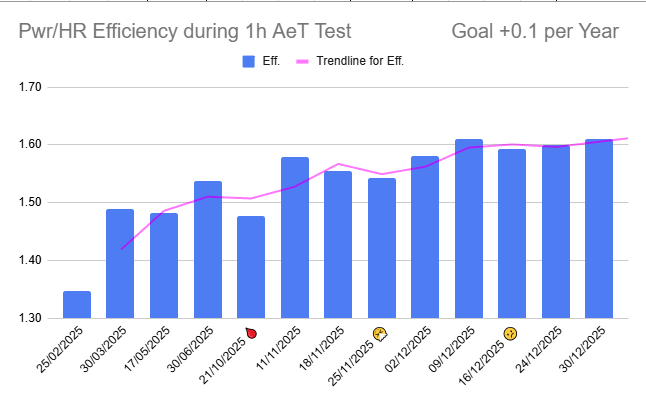
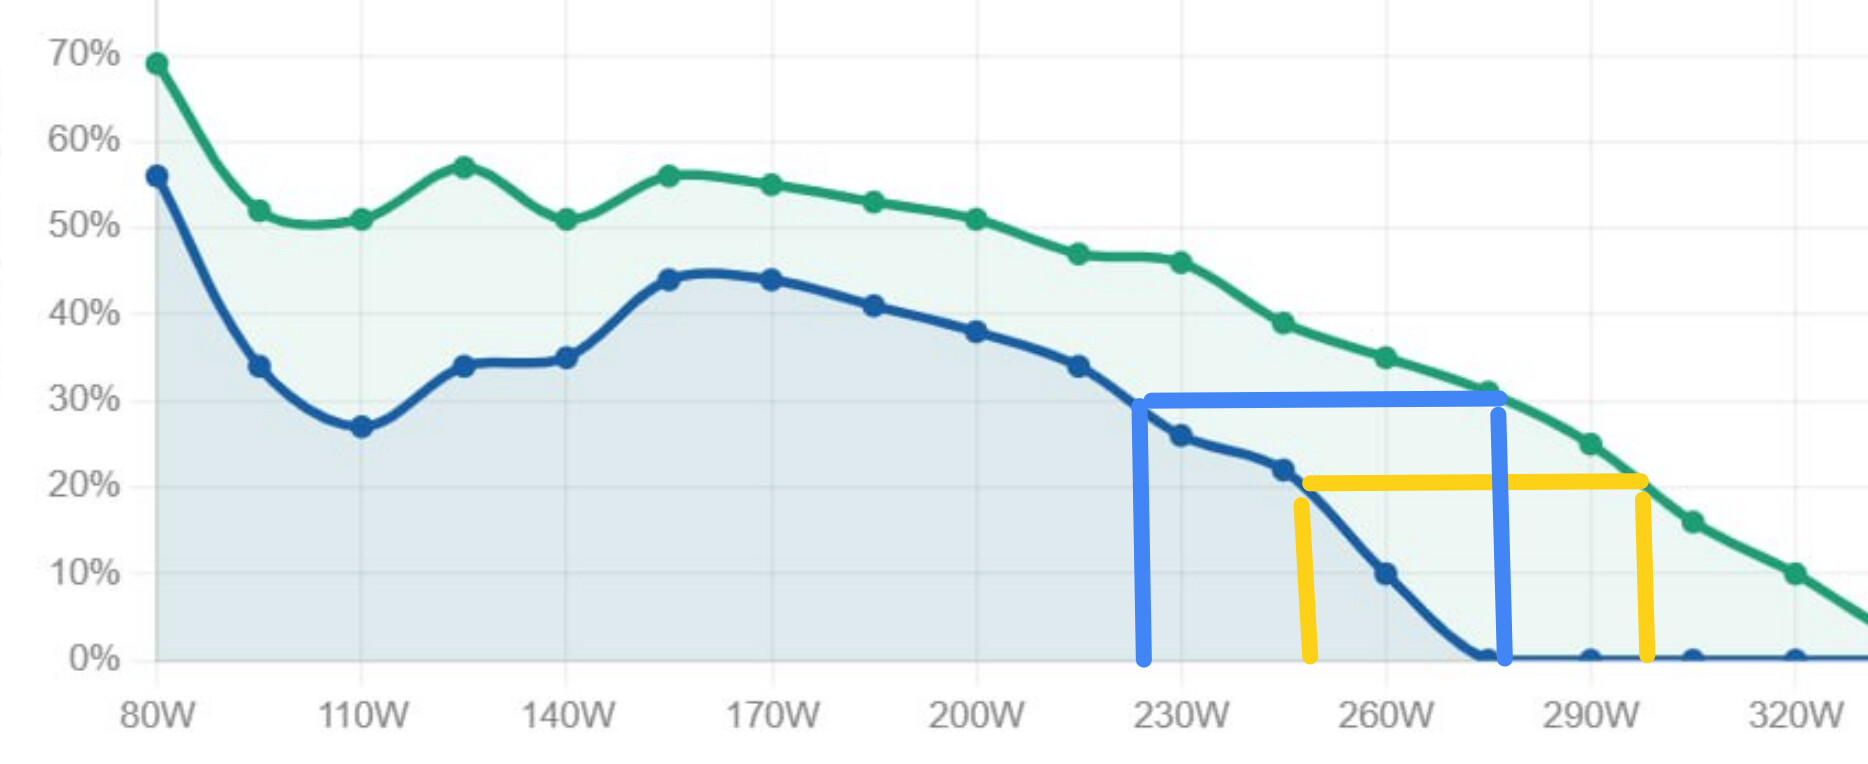
I would guess 1 hour power is about my blue line and ramp test is around the yellow line, in either case that is 20% improvement in 1 year and already at a reasonably high level, this is rather amazing.